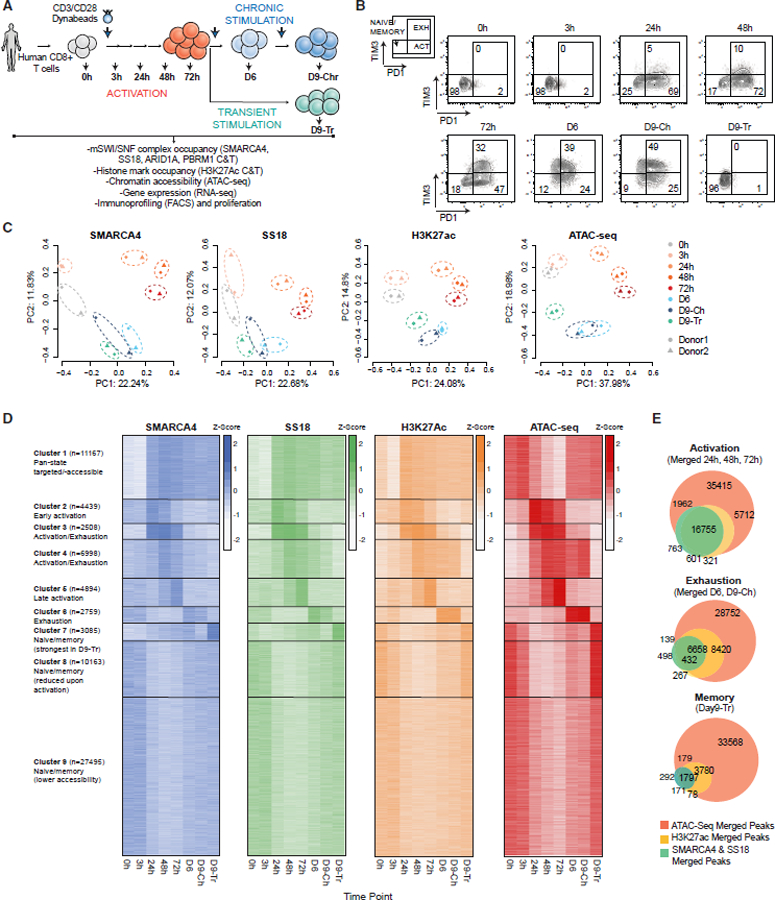
Figure 1. Stepwise changes in mSWI/SNF complex targeting and chromatin accessibility during CD8+ T cell activation and exhaustion.

(A) Schematic for CD3/CD28 bead-based stimulation of human CD8+ T cells.
(B) FACS-based profiling of PD1 and TIM3 markers indicating naive/memory, activated, and exhausted populations.
(C) PCA for mSWI/SNF subunit and H3K27Ac CUT&Tag and ATAC-seq profiles across the time course (donors 1 and 2, see KRT for donor information).
(D) K-means clustering for SMARCA4, SS18, H3K37Ac, and ATAC-seq performed over merged SMARCA4, SS18, H3K27ac, and ATAC-seq peaks; heatmap intensity depicts quantile-normalized log2-transformed RPKM values transformed into Z scores.
(E) Venn diagrams showing the overlap between SMARCA4/SS18 merged, H3K27Ac CUT&Tag peaks with ATAC-seq peaks across time points shown.
See also Figures S1 and S2.
