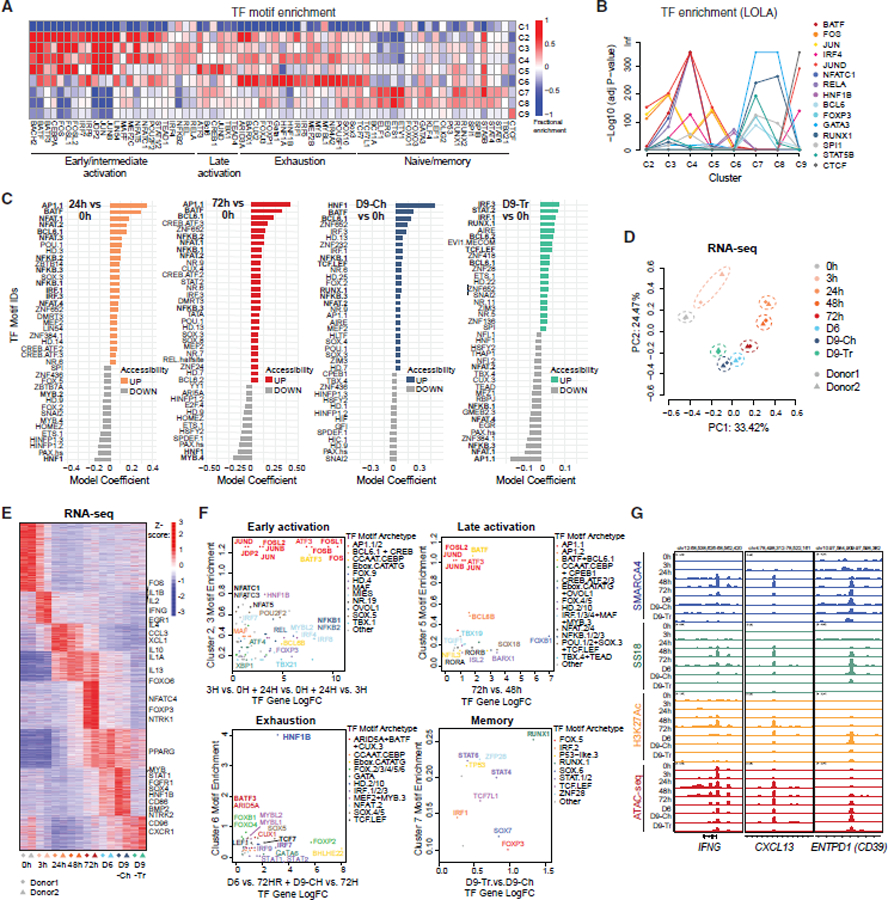
Figure 2. tate-specific transcription factor motif enrichment of mSWI/SNF complex occupancy and activity during T cell activation and exhaustion.

(A) Fractional motif enrichment in clusters C1–C9 (relative to all sites).
(B) LOLA enrichment of 15 selected TFs across C2–C9.
(C) Differential motif accessibility between time points indicated (top 40 coefficients of logistic regression models).
(D) PCA performed on RNA-seq datasets from T cells isolated from 2 independent donors at each time point.
(E) Z scored heatmap reflecting the top 25% most variable genes across the time course, partitioned into 8 groups by K-means clustering with selected genes labeled.
(F) Plots representing state (cluster(s)-specific) TF fractional motif enrichment (y axis) and gene expression (x axis).
(G) Representative SMARCA4, SS18, H3K27ac C&T, and ATAC-seq tracks over the IFNG, CXCL13, and ENTPD1 loci.
See also Figure S3.
