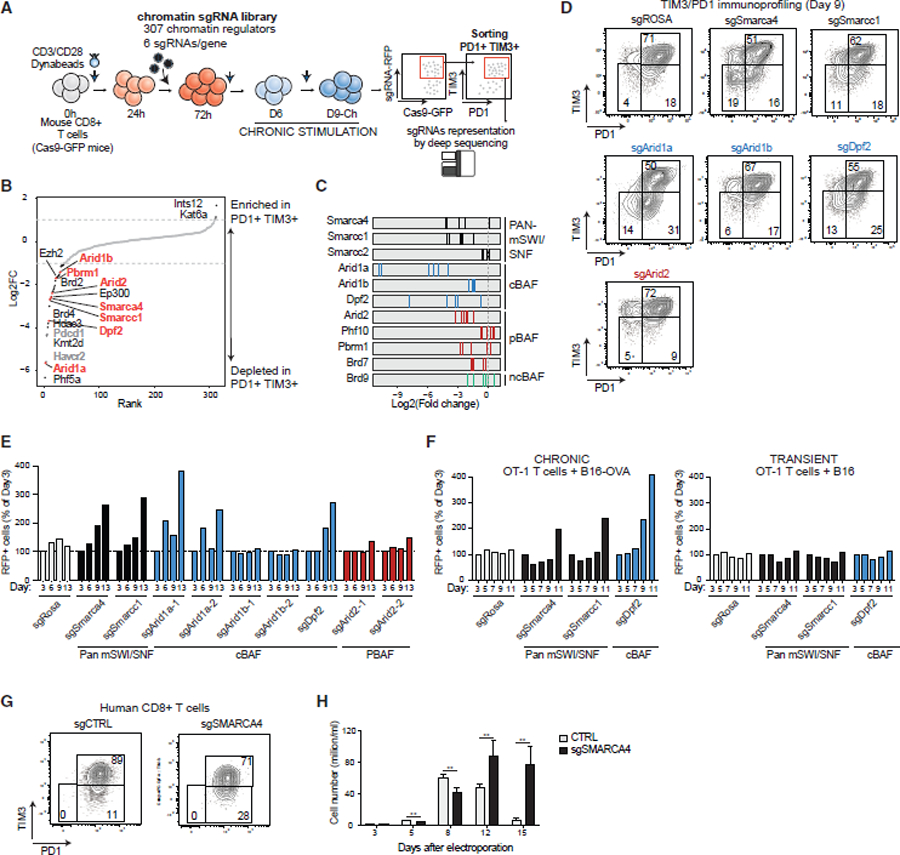
Figure 4. Chromatin-focused CRISPR-Cas9 screens identify cBAF components as regulators of T cell exhaustion.

(A) Schematic for CD8+ PD1+/TIM3+ T cell screening using a custom sgRNA library of chromatin regulators.
(B) Rank plot depicting log2FC scores (average of n = 6 guides) targeting chromatin regulator genes and negative/positive controls. Depleted genes are highlighted in black; positive controls are highlighted in gray; mSWI/SNF complex genes are highlighted in orange.
(C) Log2FC values for n = 6 independent guides in PD1+TIM3+ cells.
(D) FACS plots depicting PD1+/TIM3+ T cell populations in control and mSWI/SNF subunit KO conditions.
(E) Bar graph depicting RFP+ cells (% cells of day 3) for control, pan-mSWI/SNF, cBAF, and PBAF genes.
(F) Bar graph depicting RFP+ cells (% cells of day 3) for chronic (+B16+OVA) and transient (+B16) stimulation of OT-1 T cells in each sgRNA condition.
(G) FACS plots depicting PD1+/TIM3+ T cell populations in control and sgSRMARCA4 KO conditions in human CD8+ T cells. Donor 7 was used for this experiment, which was conducted together with the experiment in Figure 3J, thus the same control was used.
(H) Bar graph depicting cell proliferation of human sgCTRL or sgSMARCA4 CD8+ T cells. Error bars represent mean ± SD of 3 technical replicates. **p < 0.01.
See also Figure S4.
