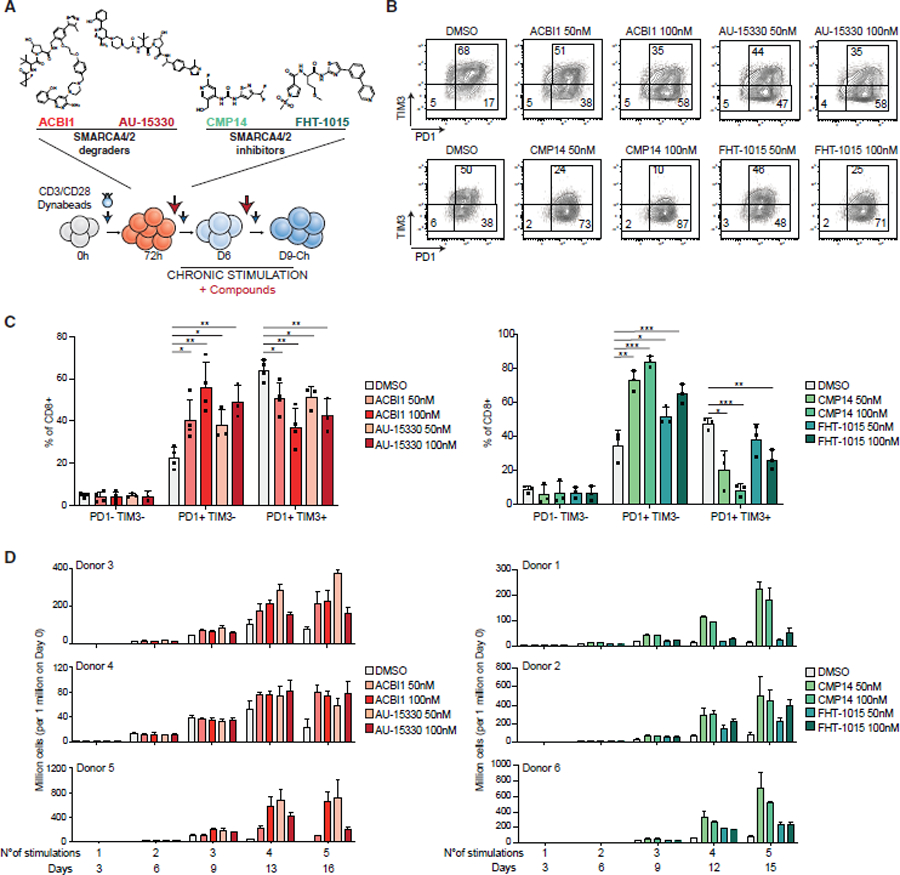
Figure 5. Pharmacologic disruption of mSWI/SNF complexes attenuates human T cell exhaustion.

(A) Schematic for inhibitor and degrader experiments with compounds added at day 3 and refreshed (with stimulation) every 3 days.
(B) FACS plots depicting PD1/TIM3 populations in CD8+ T cells at day 9 treated with 50 nM and 100 nM of SMARCA4/2 degraders (donor 3) and inhibitors (donor 1).
(C) Bar graph depicting % of CD8+ T cells in PD1−/TIM3−, PD1+TIM3−, and PD1+TIM3+ populations in DMSO, ACBI1, and AU-15330 (Left) or DMSO, CMP14 and FHT-1015 (right) conditions. Error bars represent mean ± SD of 3 or 4 independent CD8+ T cell donors. Statistical analysis was performed using an unpaired t test.
(D) Bar graphs depicting cell number upon treatment with ACBI1/AU-15330 (left, donors 3, 4, and 5) or CMP14/FHT-1015 (right, donors 1, 2, and 6). See KRT for donor information. Error bars represent mean ± SD of 3 technical replicates per donor. *p < 0.05, **p < 0.01, ***p < 0.001, and ****p < 0.0001.
See also Figures S5 and S6.
