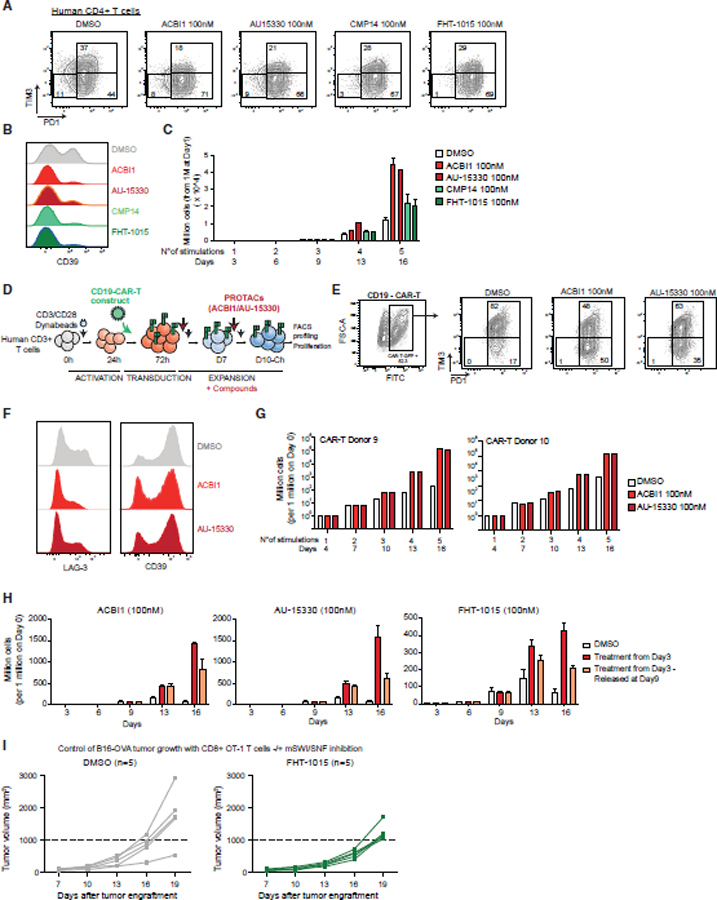
Figure 7. mSWI/SNF targeting improves T cell-based cancer immunotherapy approaches.

(A) FACS plots depicting PD1/TIM3 populations in DMSO, ACBI1, AU-15330, CMP14, and FHT-1015 conditions (100 nM), at day 9, for one human CD4+ T cell donor (donor 8).
(B) FACS plot depicting the profiling of CD39 in human CD4+ T cells treated with DMSO, ACBI1, AU-15330, CMP14, or FHT-1015 (100 nM), at day 9.
(C) Bar graph depicting human CD4+ T cell number upon treatment with DMSO, ACBI1, AU-15330, CMP14, or FHT-1015 (100 nM). Error bars represent the mean ± SD of 3 technical replicates of one donor.
(D) Schematic for CD19-CAR-T cell generation, stimulation, and treatments.
(E) FACS plots depicting CD19-CAR-T-GFP cells identification and PD1/TIM3 populations, in cells treated with ACBI1 or AU-15330 (donors 9 and 10).
(F) FACS histograms of LAG-3 and CD39 expression in CAR-T cells treated with DMSO, ACBI1, or AU-15330.
(G) Bar graphs depicting CAR-T cell number upon treatment with DMSO, ACBI1, or AU-15330 (100 nM). Error bars represent the mean for each donor.
(H) Bar graphs depicting cell number upon treatment with ACBI1, AU-15330, or FHT-1015 (all 100 nM) at day 3 onward or at day 3 with treatment washout at day 9. Error bars represent mean ± SD of 3 technical replicates of one donor.
(I) In vivo B16 melanoma tumor growth curves in mice injected with DMSO or FHT-1015-treated CD8+ OT-1 T cells. Two-way ANOVA generated p value for comparison between the two groups’ means at day 19: p < 0.05.
See also Figure S7.
