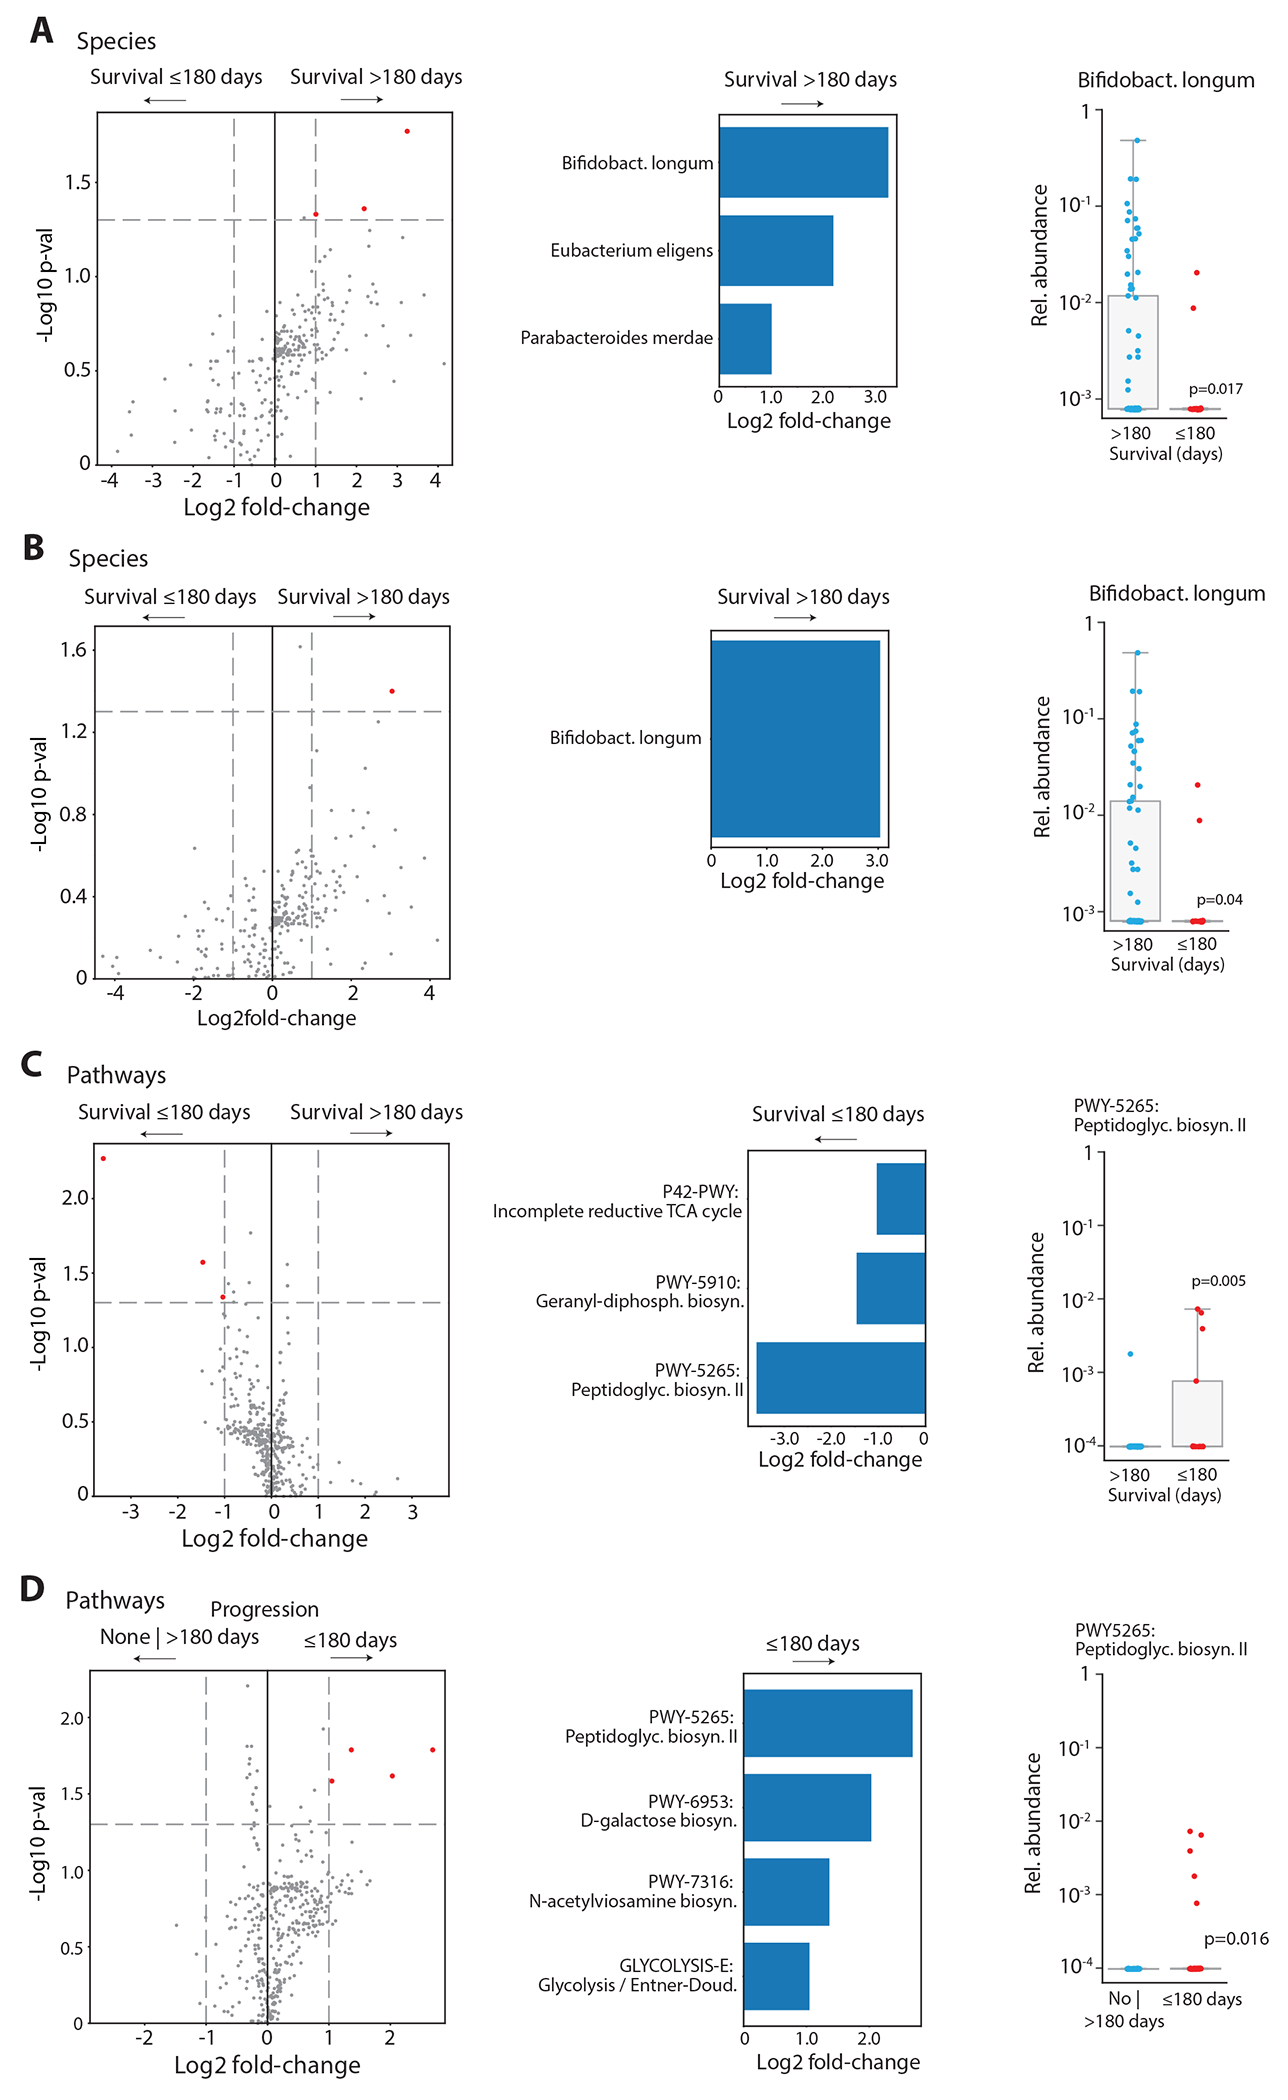
Extended Data Figure 7. Analyzing microbiome features associated with major outcomes of CAR-T cell therapy.

Differential abundance analyses were done as described in Extended Data Figure 7 with different grouping variables. (A) Left, volcano plots showing species and metabolic pathway compositions of the abundance in patients with survival > 180 day (n = 77) / abundance in patients with survival ≤ 180 day (n= 18) versus the significance of the abundance difference by Mann–Whitney tests. All samples collected in the pre-infusion period were included here. Features with a p-value < 0.05 and absolute log2 change > 1 are shown in red. Middle, bar-plots indicating the fold-change of the top species found in (A). Right, comparison of the relative abundances of the indicated species between patients with survival shorter or longer than 180 days. (B) As in (A), but samples collected during and less than two weeks after exposure to high-risk antibiotics were excluded (alive: n = 66; dead: n = 13). (C and D) As in (B), for metabolic pathways encoded in fecal metagenomes comparing 6-months survival (alive vs. dead at day 180) and early progression (≤ 180 days: progression within 6 months after infusion vs. no progression within follow-up or progression after day 180; n = 37 vs. n = 42). Group comparisons were computed by Mann-Whitney tests.
