
Extended Data Figure 9. Summary of differentially abundant microbiome features by clinical variables and outcomes excluding baseline specimens collected while or within 2 weeks after exposure to high-risk antibiotics.
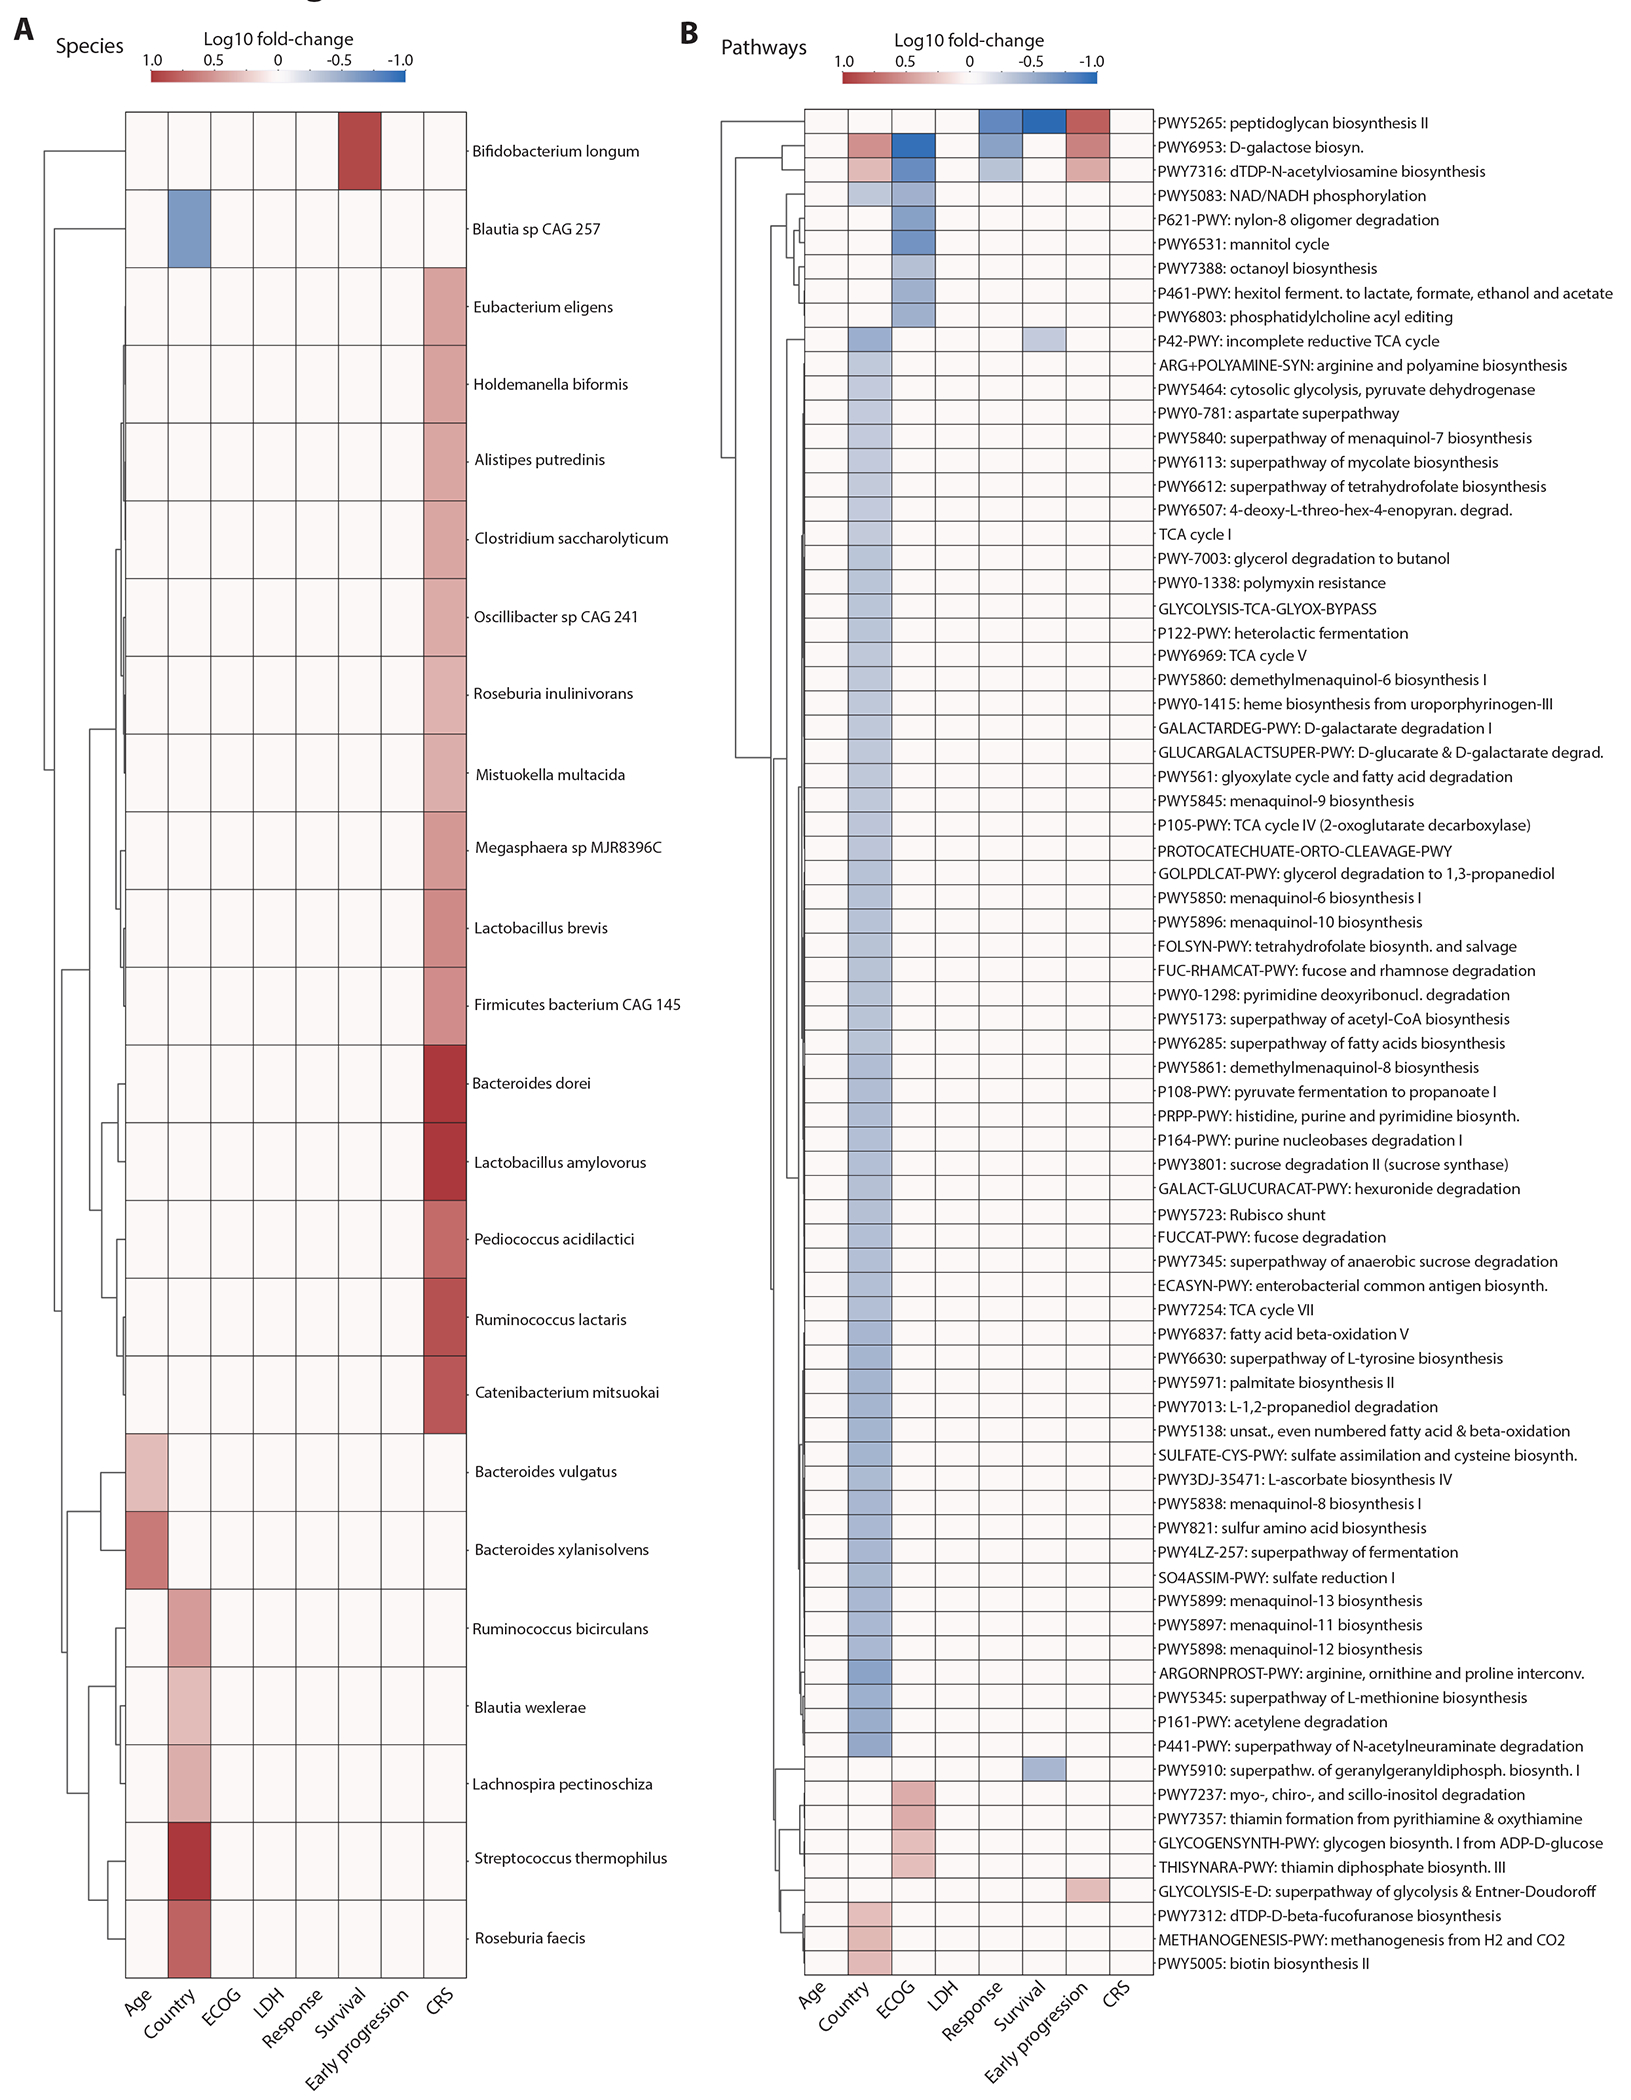
Heatmaps showing the associations between the species (A) and metabolic pathways (B) of the baseline gut microbiome and clinical parameters and major outcomes (Mann–Whitney tests, p-value < 0.05). Color indicates the Log10 of the following ratios: age (>= 65 / < 65 years), country (Germany / US), ECOG (grades 0-1 / 2-3), LDH (LDH at lymphodepletion chemotherapy: >= 280 / < 280 U/ml), response (CR / no CR at day 180), survival (alive / dead at day 180), early progression (lymphoma progression until day 180 / progression > 180 days or no progression during follow-up) and CRS (grades <=1 / >1). Associations with p-value > 0.05 or with absolute log2 fold change < 1 were set on the heatmap to have a log10 fold change of zero.