
Figure 4. RBC adhesion to REV-activated HPMECs correlates with subject clinical phenotype including hemolytic and inflammatory biomarkers.
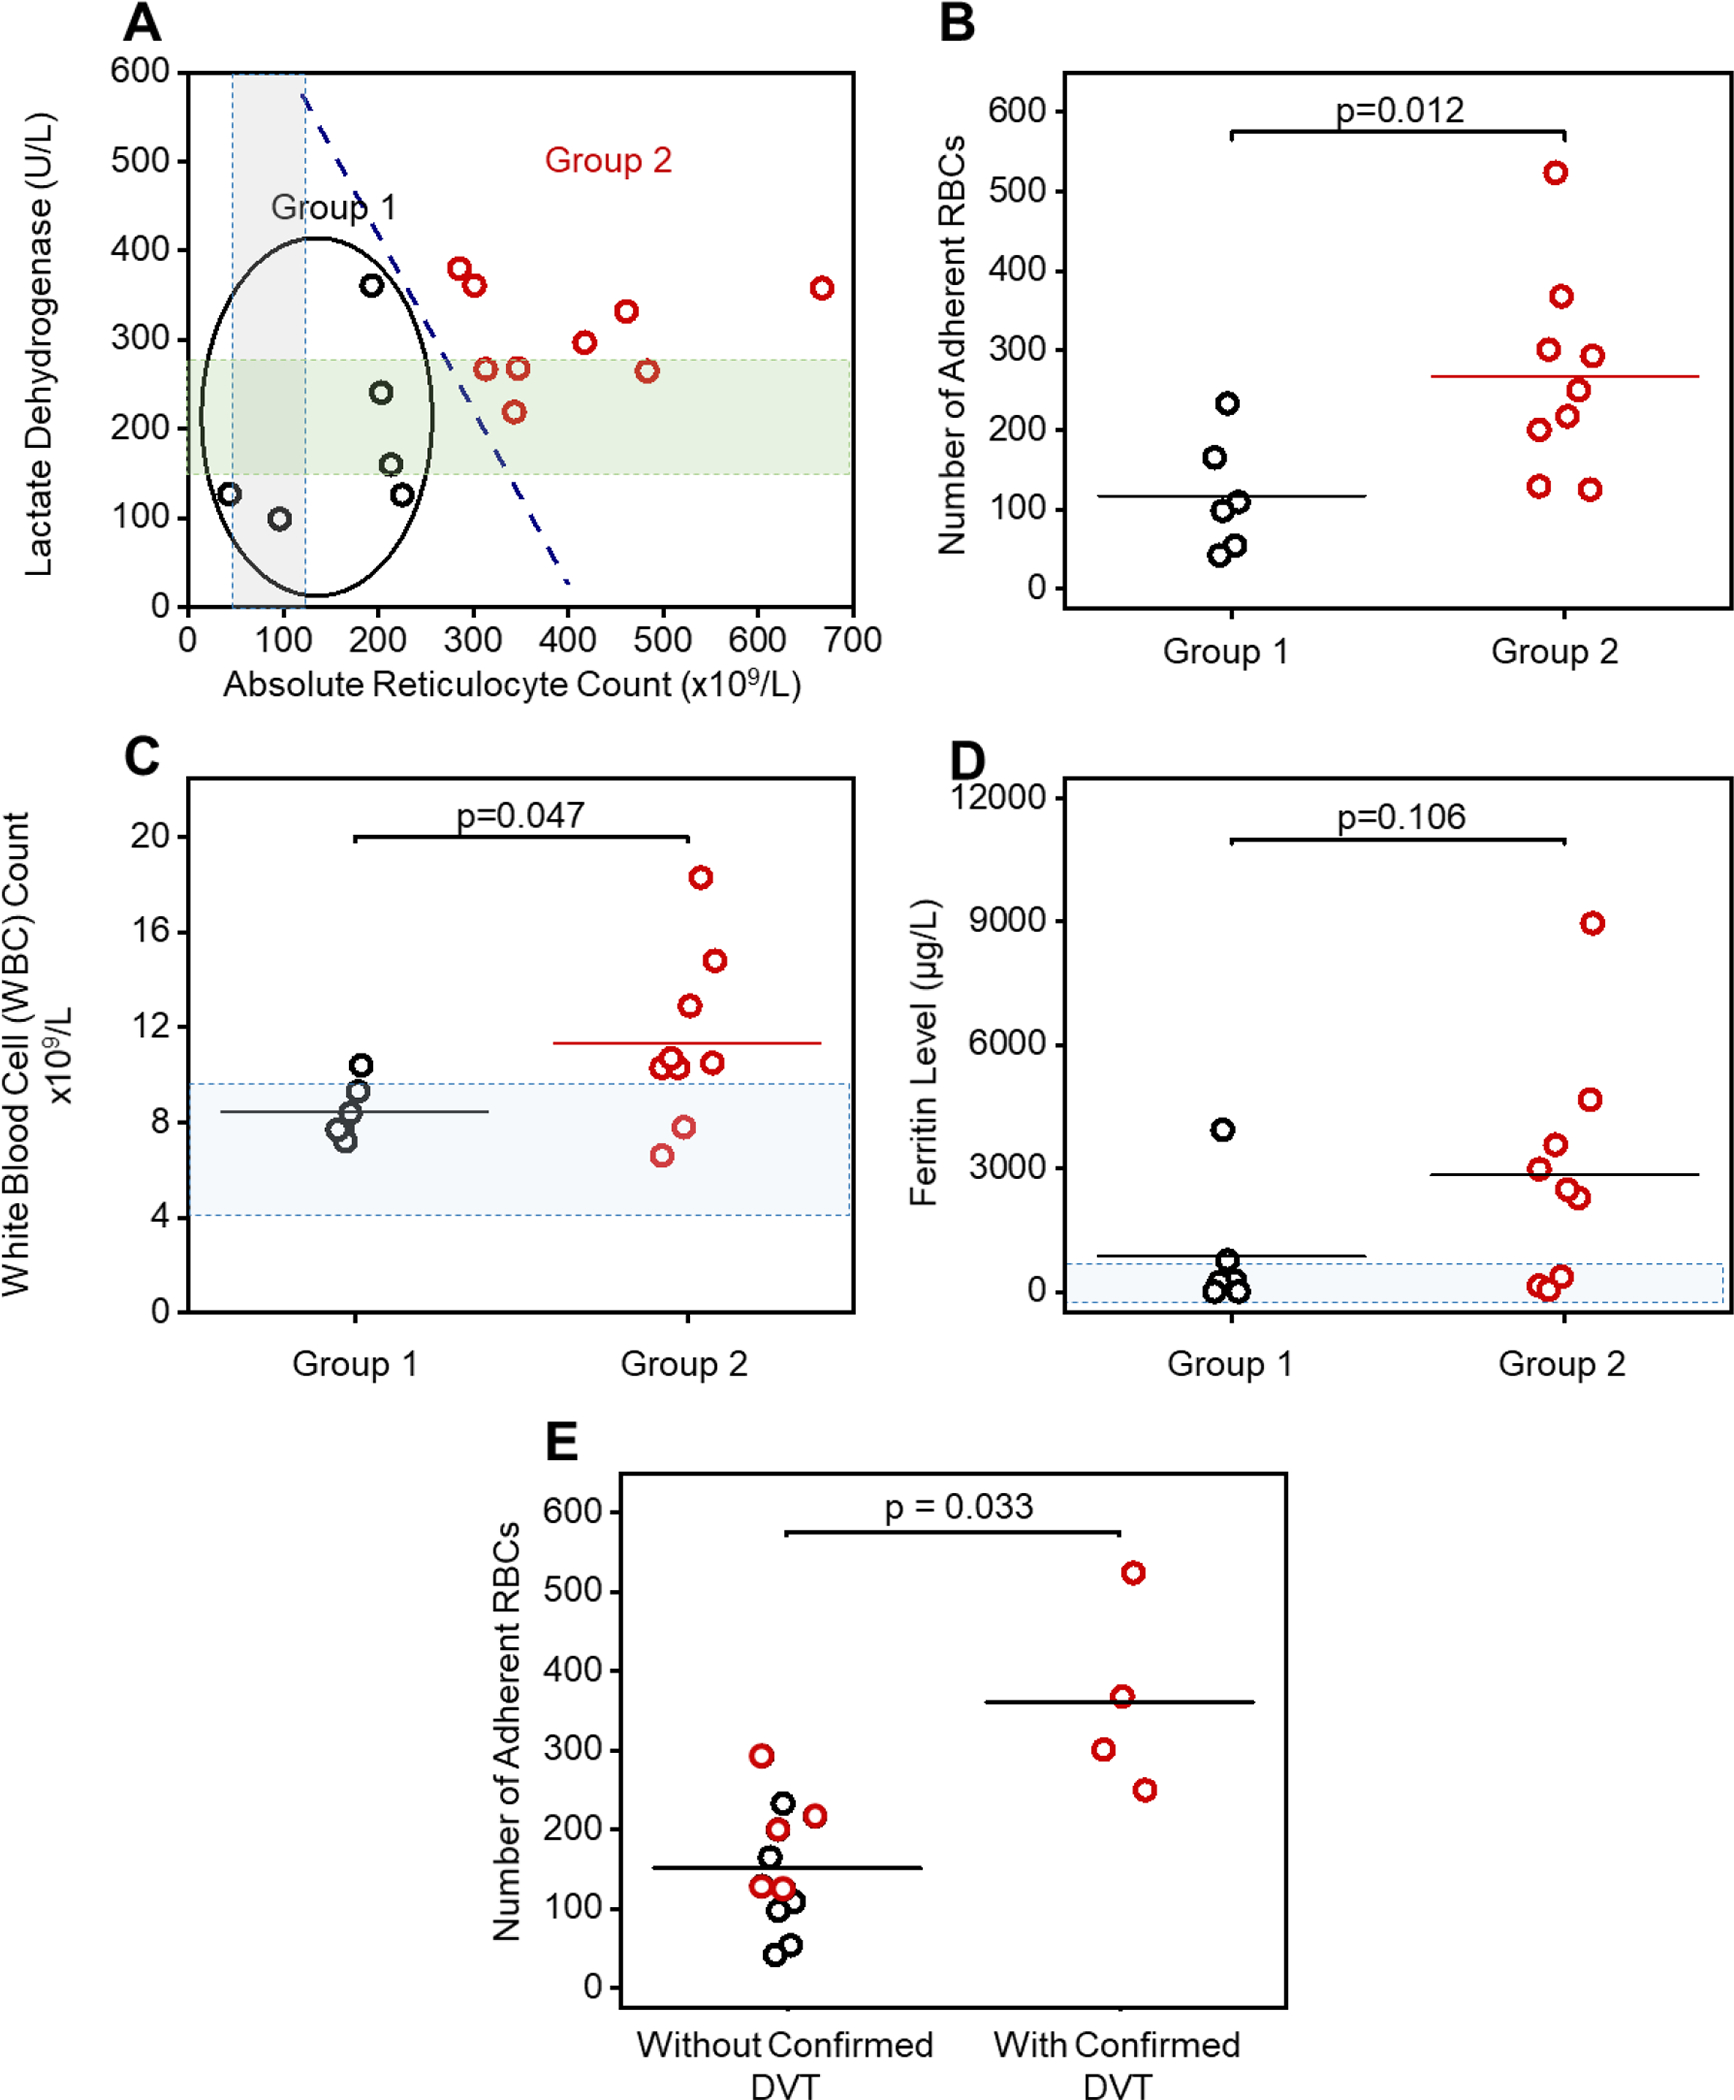
(A): A subpopulation (Group 1, N = 6) with distinct hemolysis markers of lactate dehydrogenase (LDH) levels and absolute reticulocyte count (ARCs) comparing to the rest (Group 2, N = 9) via k-means clustering analysis. RBCs from subjects in Group 2, with significantly higher LDH levels and ARCs, have greater adhesion to REV-activated HPMECs compared to the RBCs from subjects in Group 1 (B, Mean ± SD: 267 ± 125 vs. 117 ± 72, p = 0.012, 2-Group t test). The gray and green shaded areas indicate normal ranges for ARC and LDH, respectively. (C): Subjects in Group 2 with higher LDH and ARC and enhanced RBC adhesion have significantly higher WBC counts, than subjects in Group 1 (Mean ± SD: 11.4 ± 3.6 vs. 8.5 ± 1.2, p = 0.47, 2-Group t test). Shadowed area: WBC count range from 4.5 to 10 × 109. (D): Subjects in Group 2 with higher LDH and ARC and enhanced RBC adhesion have higher ferritin levels, although not statistically significant, than subjects in Group 1 (2841 ± 2804 vs. 876 ± 1527, p = 0.106, 2-Group t test). Shadowed area: normal range of ferritin level (2 to 1000 μg/L) [71, 72]. (E) Subjects with confirmed deep vein thrombosis (DVT) had significantly higher RBC adhesion to REV activated HPMECs than the ones without confirmed DVT (Mean ± SD: 361 ± 119 vs. 151 ± 78, p = 0.033, 2-Group t test). Six out of six subjects in Group 1 patient with lower RBC adhesion, and three out of six subjects in Group 2 did not have DVT. Four out of eight subjects in group 2 with higher RBC adhesion had DVT. DVT status of two out of eight subjects in Group 2 were not available (1 patient diagnosed as ‘unclear’, 1 patient record not accessible).
*In Fig. 4C 2 patients had the exact same WBC count at 7.1×10⁹/L