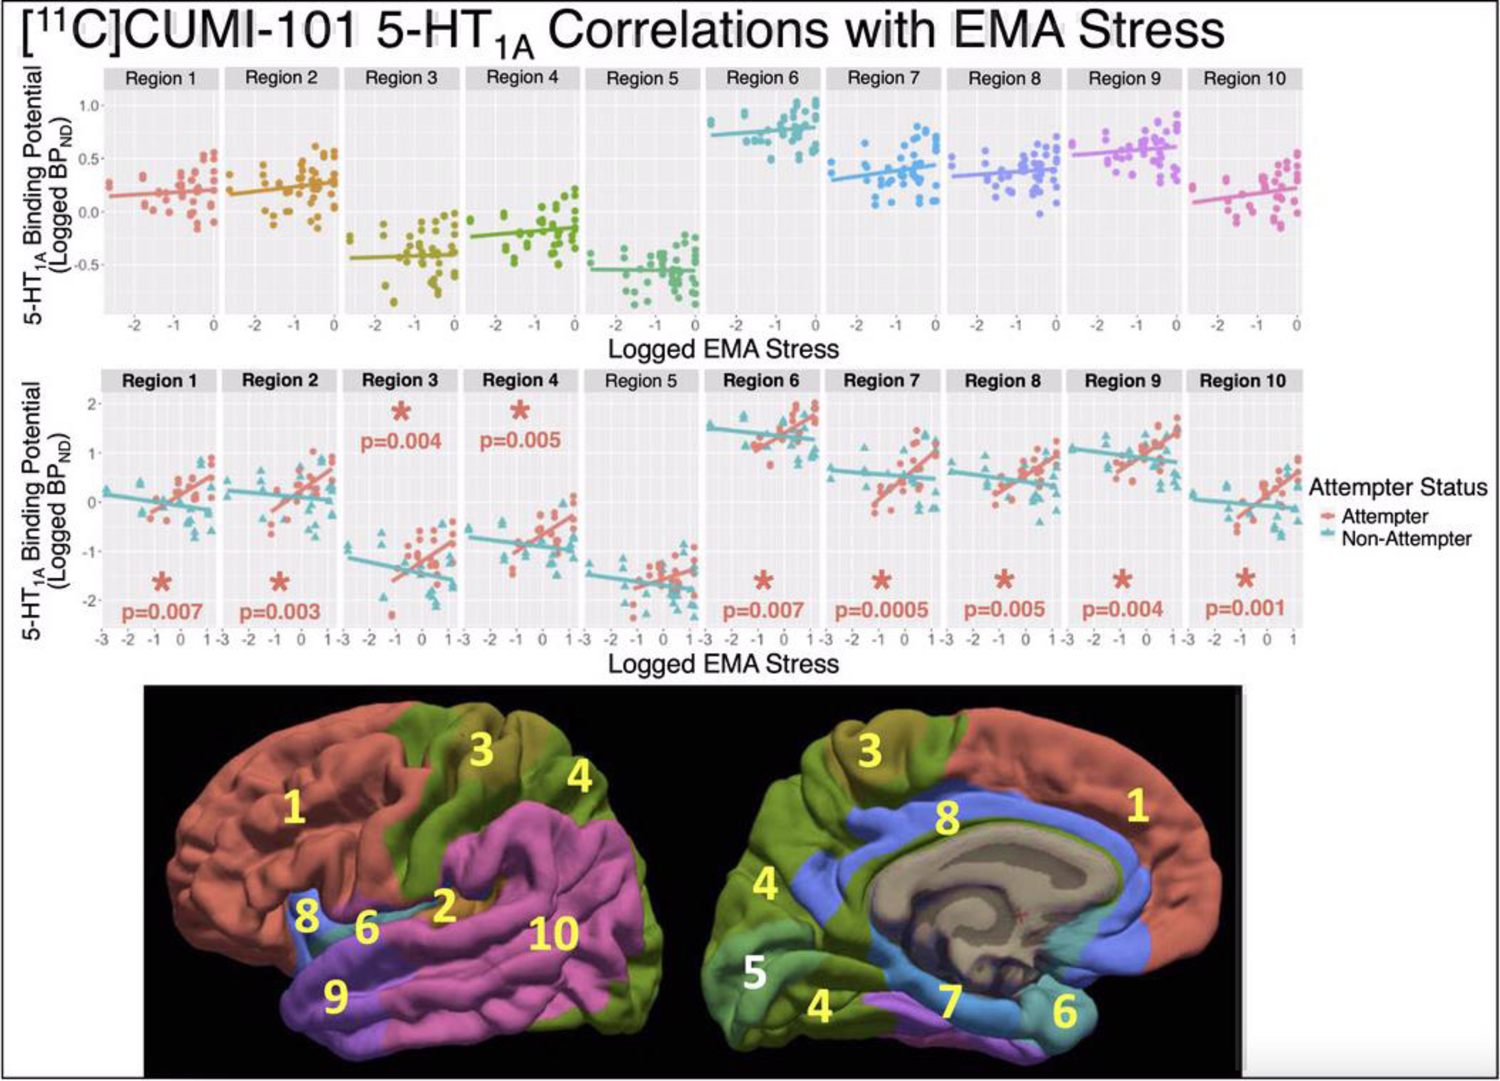
Figure 2.

NRU 5-HT atlas Results: Scatter plots of log-transformed [11C]CUMI-101 5-HT1A BPND estimates (y-axes) versus the log-transformed EMA stress measure. Individual scan data-points are repeated in the top and center panes, but different regression lines are shown. Top: Regression line across all participants, visualizing non-significant effect of EMA stress by region (p=0.61). Middle: Regression lines for both suicide attempters (pink) and nonattempters (blue), where attempter data-points are plotted with circles and nonattempter data-points are with triangles, visualizing significant effect of EMA stress by region in attempters (p=0.005) and non-significant effect in nonattempters (p=0.95). Bottom: The 10 regions of the NRU 5-HT atlas are shown on the lateral (left) and medial (right) fsaverage surfaces, with regions revealed as p<0.05 in post-hoc testing marked with yellow font. For Regions with post-hoc p<0.05, metrics of effect size include: Region 1: β = 0.33 and r = 0.71, Region 2: β = 0.38 and r = 0.70, Region 3: β = 0.36 and r = 0.54, Region 4: β = 0.34 and r = 0.65, Region 6: β = 0.33 and r = 0.70, Region 7: β = 0.45 and r = 0.72, Region 8: β = 0.35 and r = 0.75, Region 9: β = 0.36 and r = 0.71, and Region 10: β = 0.41 and r = 0.75 (β estimates from Table 2).
