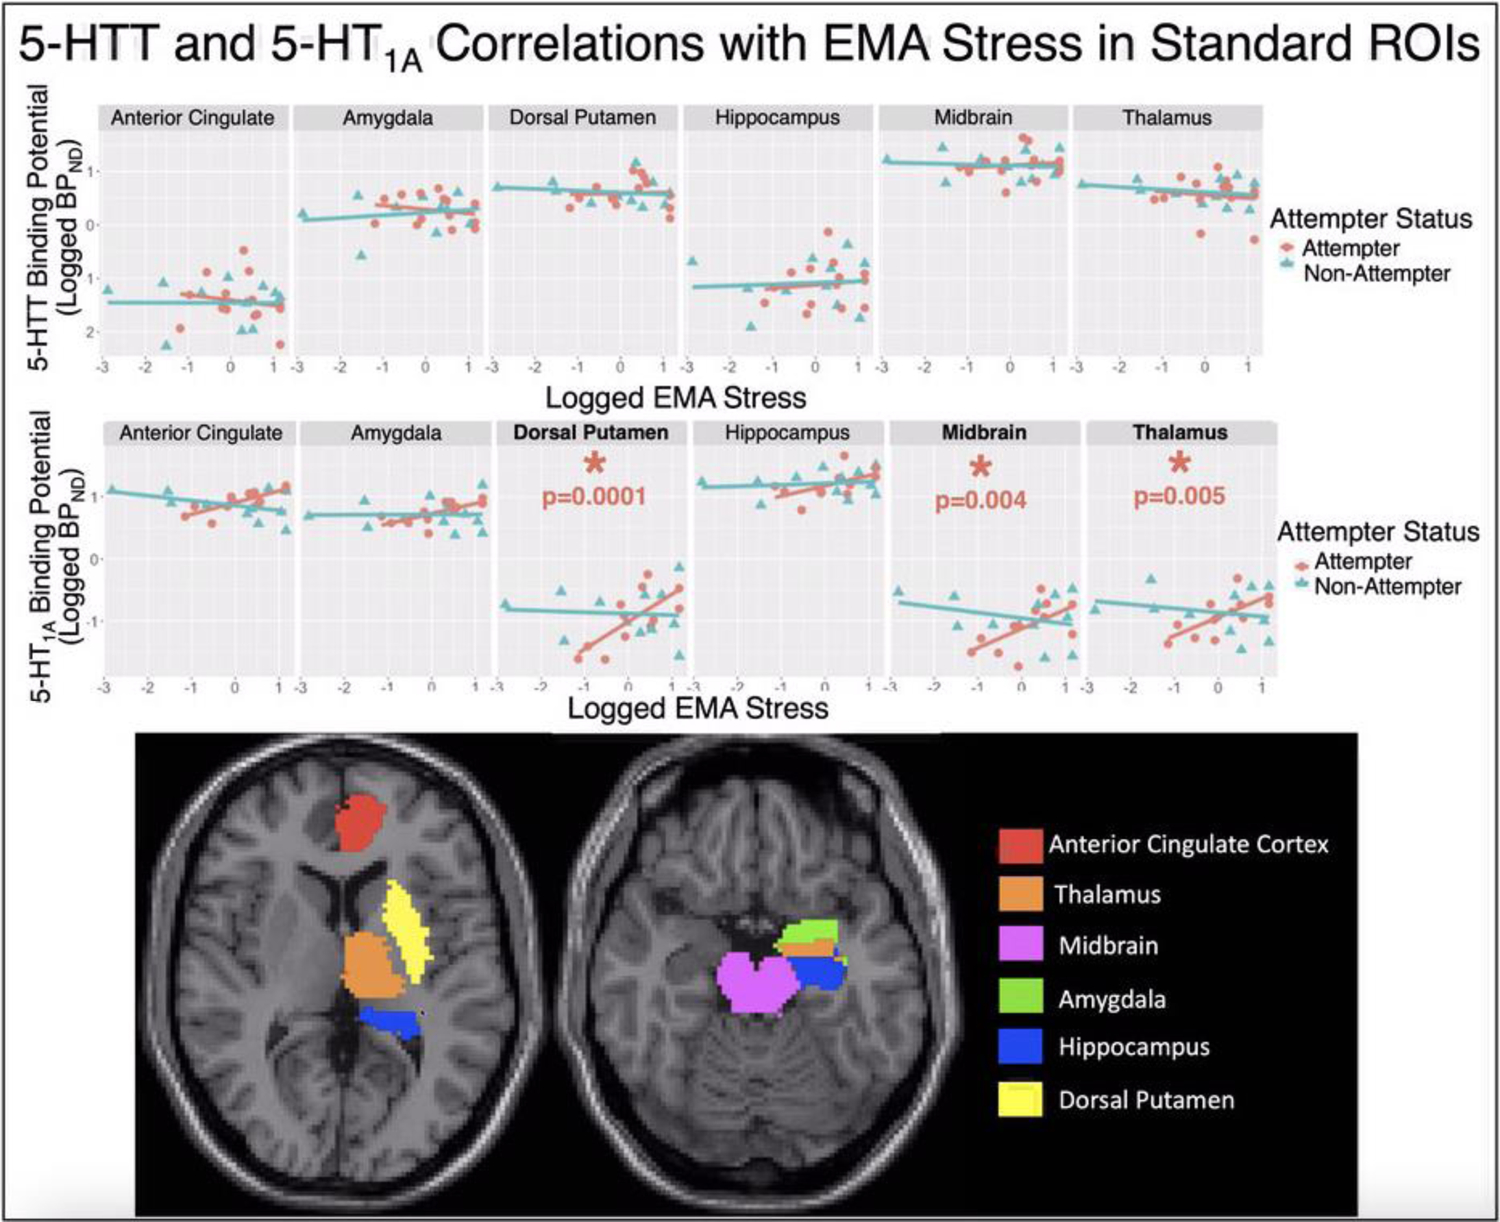
Figure 4.

Standard Brodmann Area-Based In-House atlas Results: Scatter plots of log-transformed [11C]CUMI-101 5-HT1A BPND estimates (y-axis; TOP) and [11C]DASB 5-HTT BPND estimates (y-axis; MIDDLE) versus the log-transformed EMA stress measure (x-axes). Top and middle: Regression lines for both suicide attempters (pink) and nonattempters (blue), where attempter data-points are plotted with circles and nonattempter data-points are with triangles. Bottom: The six regions from our in-house atlas are shown on slices of a Montreal Neurological Institute (MNI) space structural MRI. For Regions with post-hoc p<0.05, metrics of effect size include: dorsal putamen: β = 0.44 and r = 0.72, thalamus: β = 0.30 and r=0.70, and midbrain: β = 0.31 and r = 0.61.
