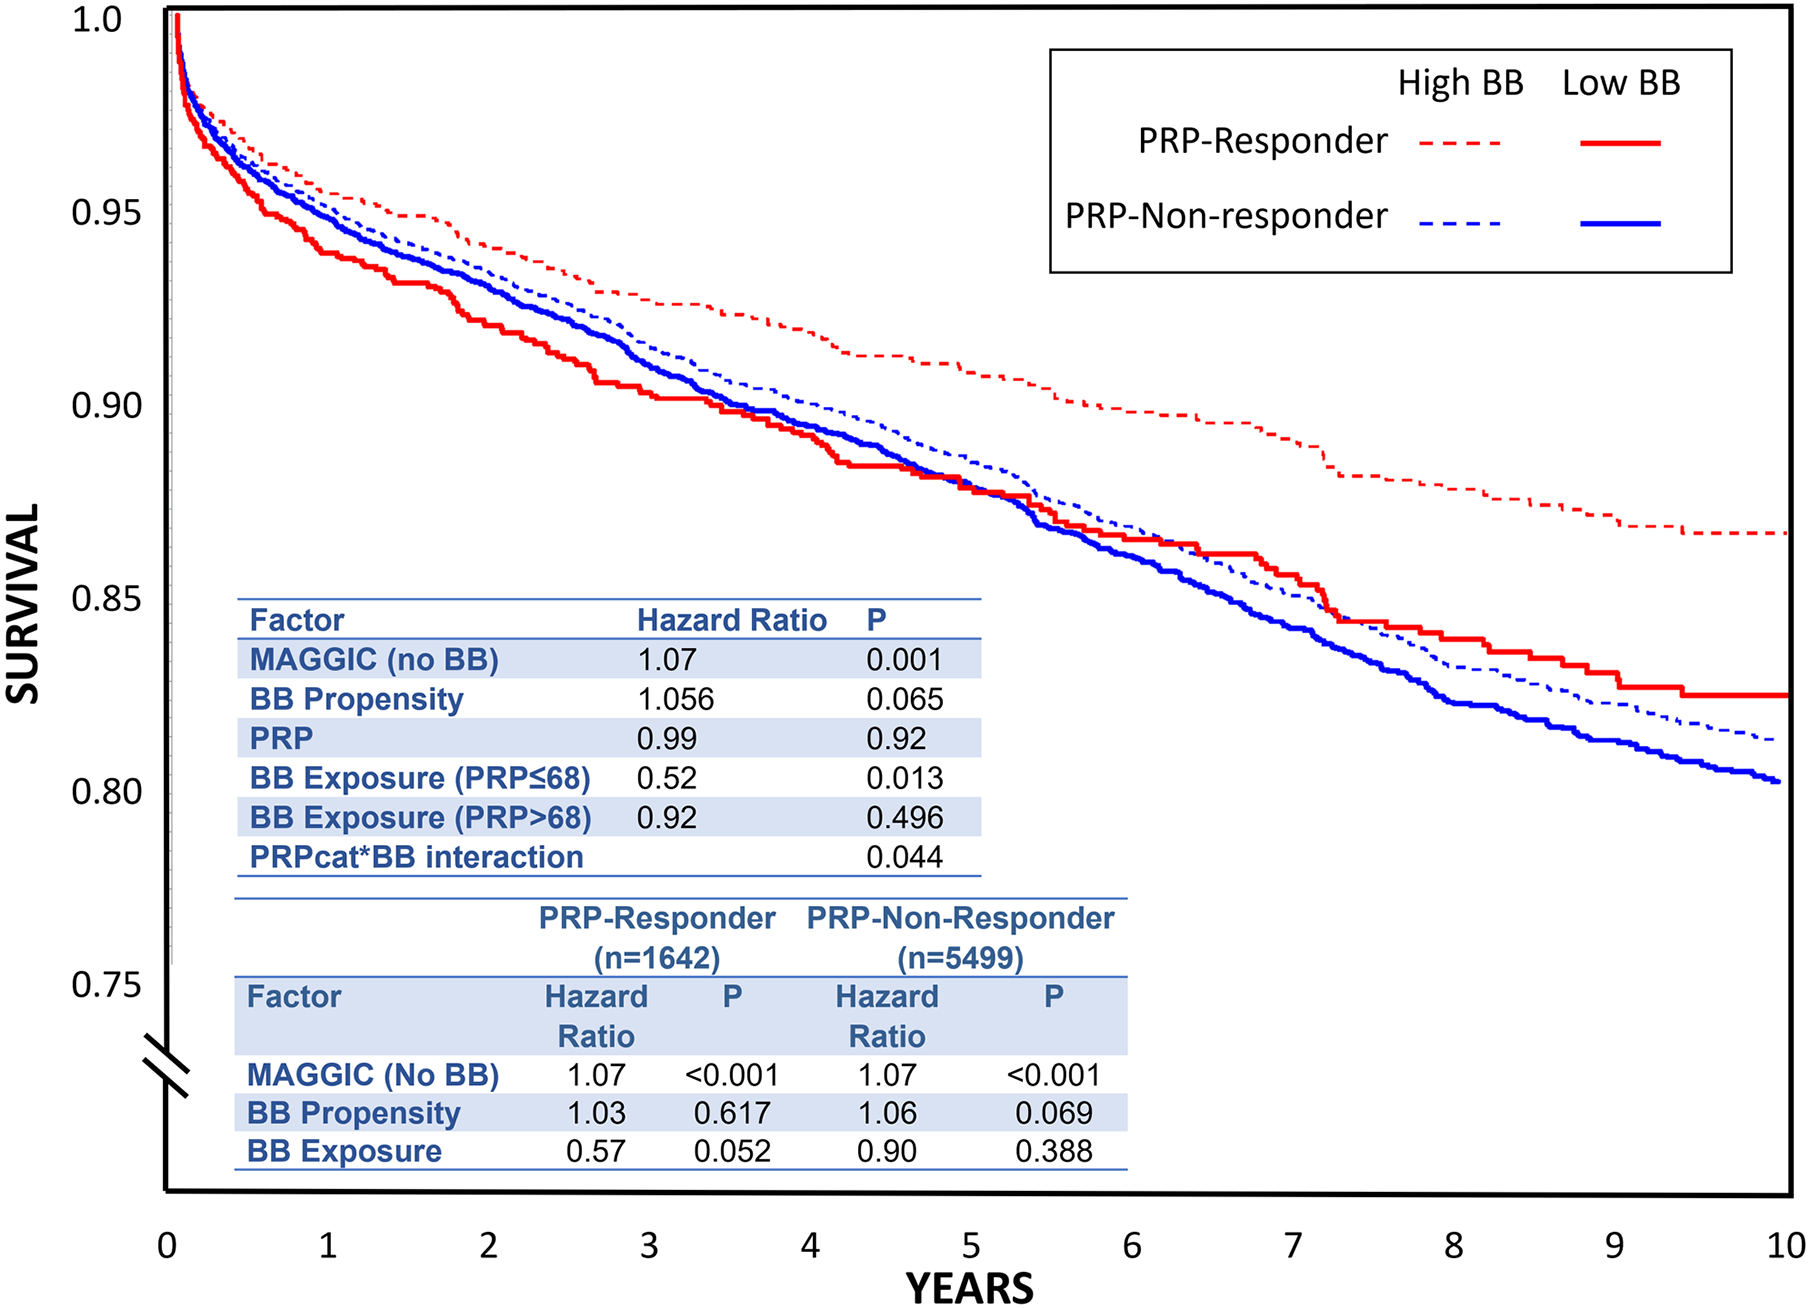
Figure 1.

Survival curves from Cox modeling depicting first quartile (solid) versus third quartile (dotted) of beta blocker exposure, separated by PRP categories (red are predicted responders and blue are predicted non-responders). The space between the dotted and solid lines (of the same color) represents the survival impact of beta blocker exposure. Top embedded table is the output of the primary analysis. The bottom table shows results stratified by PRP category (predicted responder vs. predicted non-responder).
