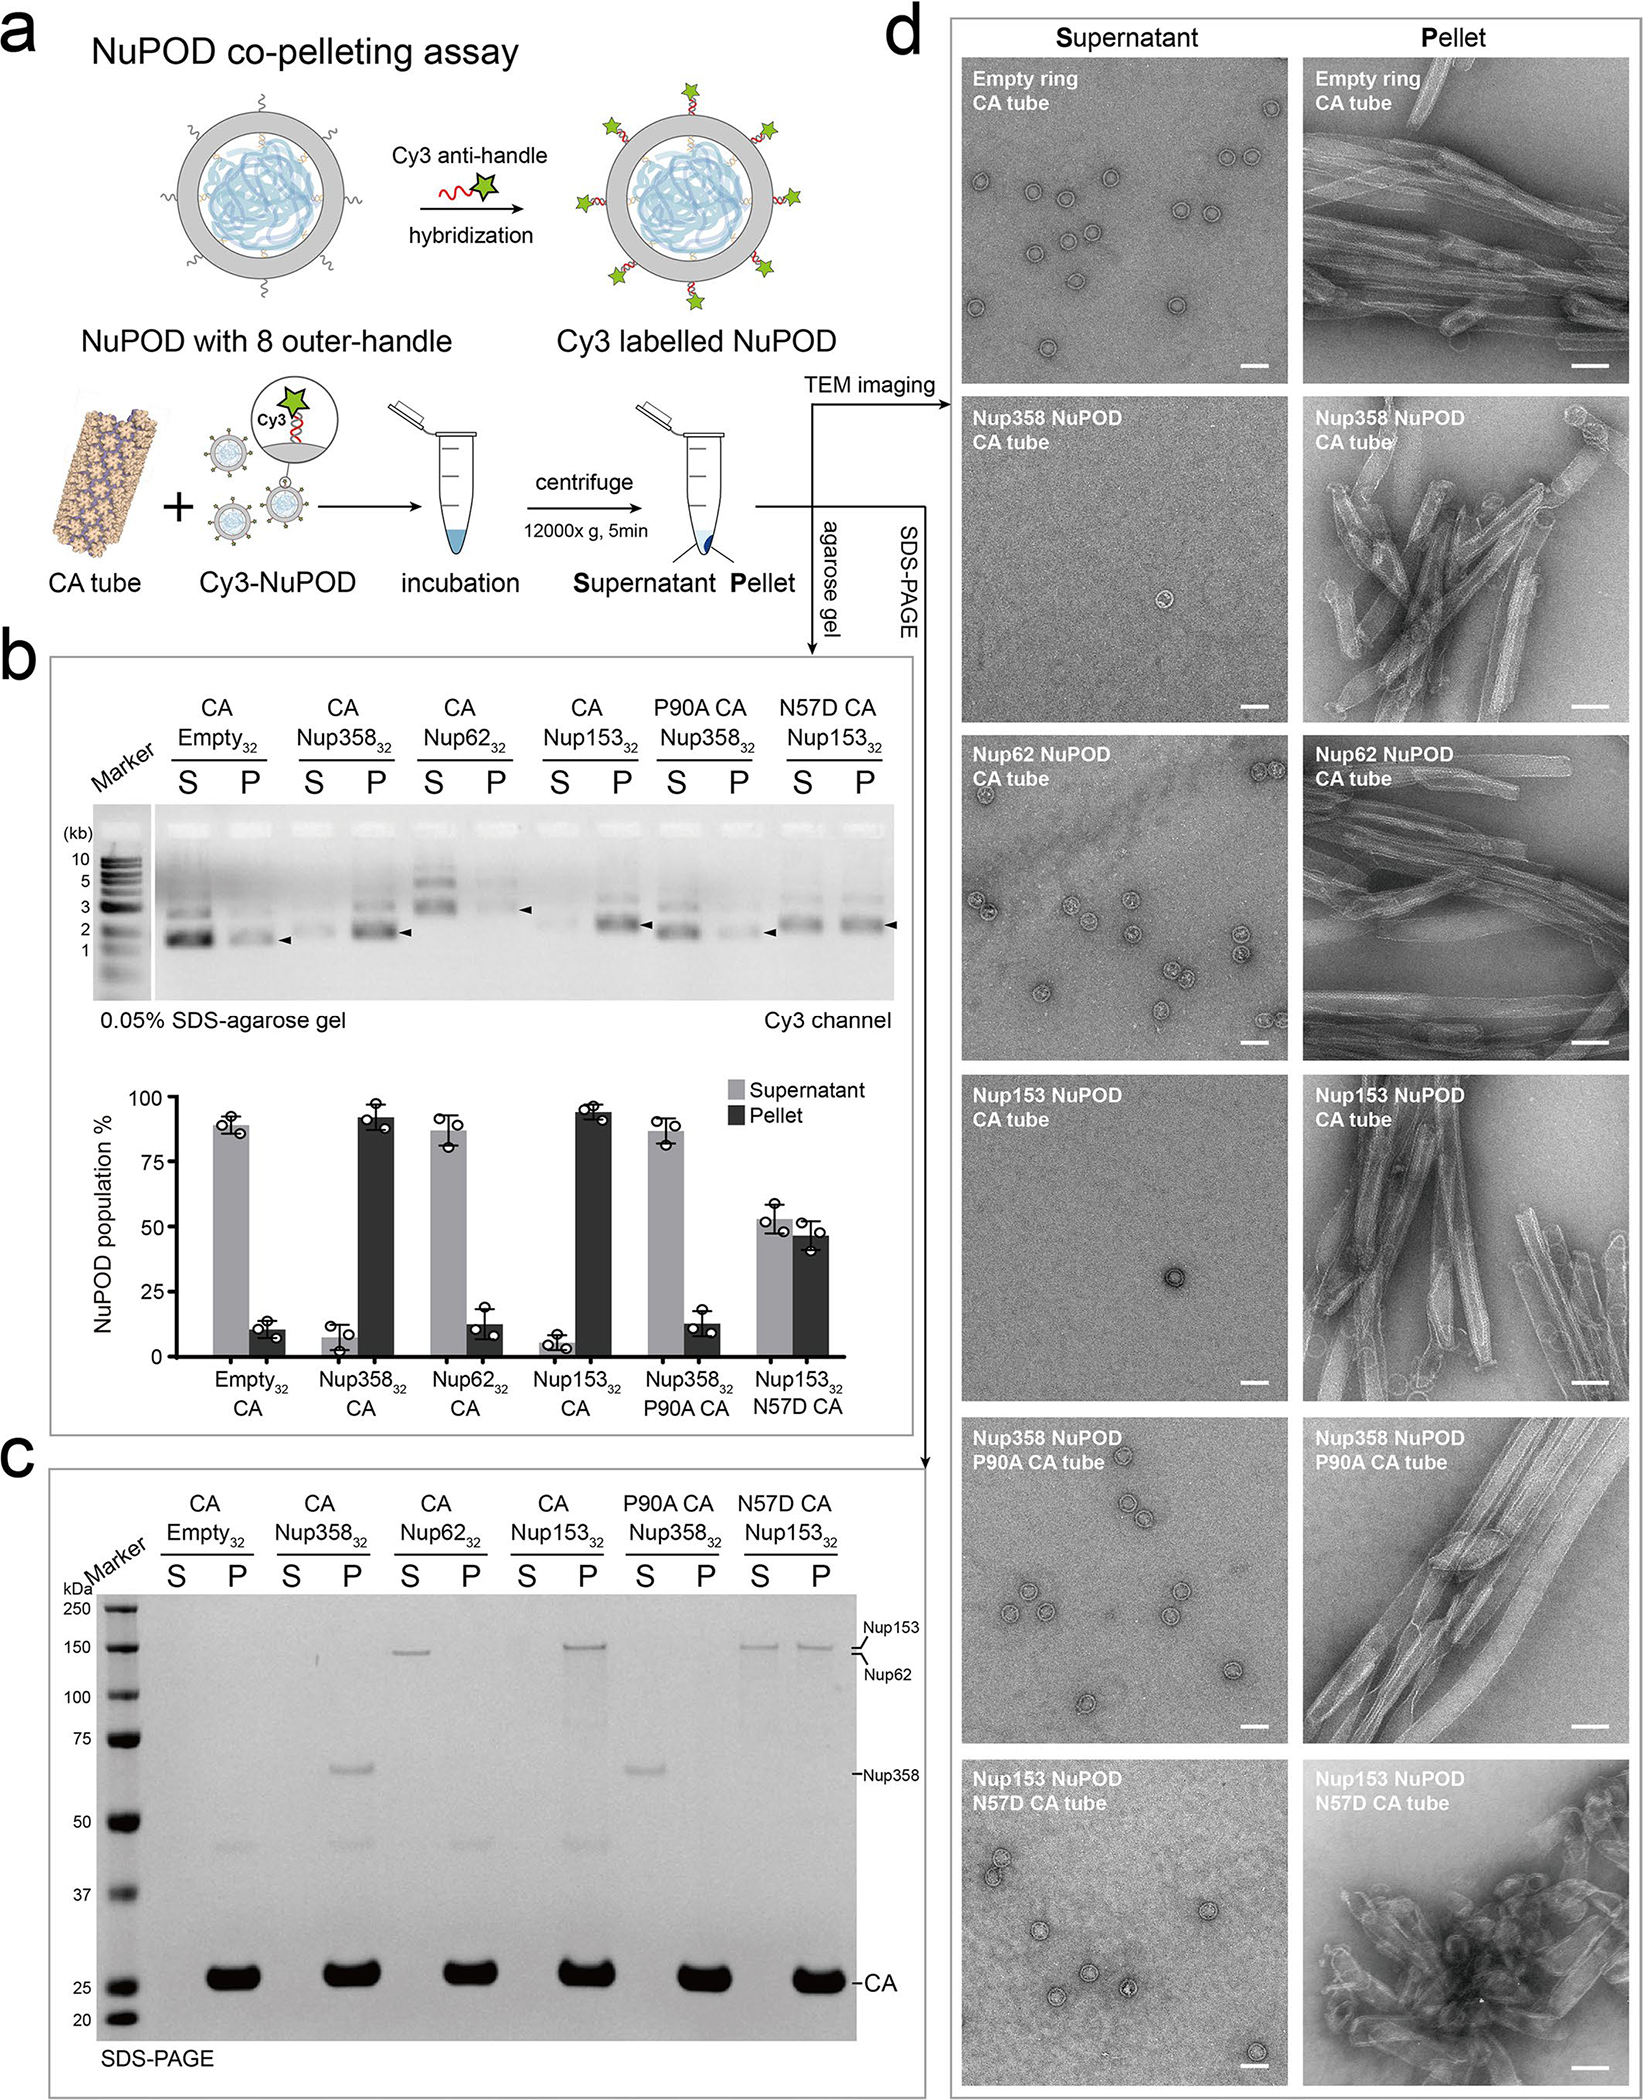
Extended Data Fig. 6 |. Co-pelleting assays of NuPODs with variants of CA tubes.

a, Schematic of the NuPOD-CA nanotube co-pelleting assay. b, Top: Supernatant (S) and pellet (P) fractions collected after co-pelleting Cy3-labelled NuPODs and A14C/E45C disulfide crosslinked CA tubes were analyzed on a 0.05% SDS–agarose gel. Fluorescence signals were used to detect the Cy3-labelled NuPODs. Black arrowheads indicate the NuPOD bands. Bottom: a plot showing the populations of Cy3-labelled NuPODs in the supernatant and pellet fractions. Data are plotted as mean±SD of three independent experiments (n = 3), with individual data points shown as black circles. c, Supernatant (S) and pellet (P) fractions from the co-pelleting assays analyzed by SDS-PAGE to detect the protein component of the NuPODs. The experiment was repeated three times with similar results. d, Negative-stain electron micrographs of supernatant (S) and pellet (P) samples from the co-pelleting assays. The experiment was repeated three times with similar results. Scale bar, 100 nm.
