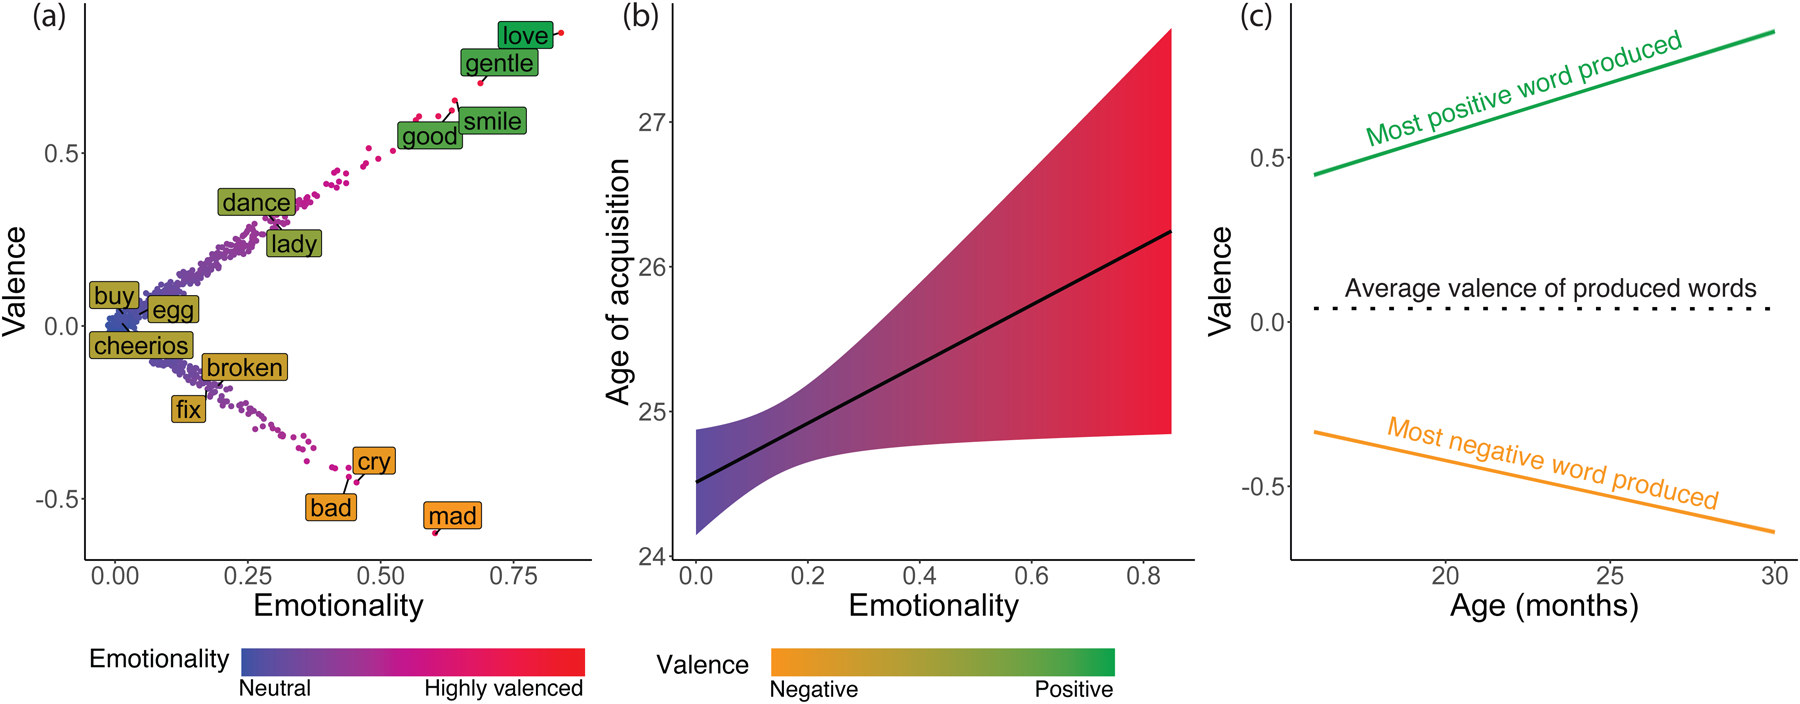
Figure 1.

Panel (a) shows the distribution of valence (y-axis) and emotionality (x-axis) across all words in the MCDI. Since emotionality is computed as the absolute value of valence, highly positive and negative words are both high in emotionality. Points were randomly jittered to show the spread of values. A few select words are highlighted to illustrate the kinds of words that are in different parts of the spectrum. The color of the points represents their emotionality (highly positive / negative words in red and neutral words in blue), and the color of the words represents their valence (negative words in yellow and positive words in green). Panel (b) shows the relation between the emotionality of a word (on the x-axis), and the age of acquisition of the word as the age at which 50% of children produce the word based on wordbankr (on the y-axis). The shaded area shows a 95% confidence interval of the prediction. Panel (c) shows the link between age and the valence of the most positive (green) and most negative (yellow) word that children at the corresponding age in this sample produced. The dashed line represents the average valence of all words produced by children at a given age.
