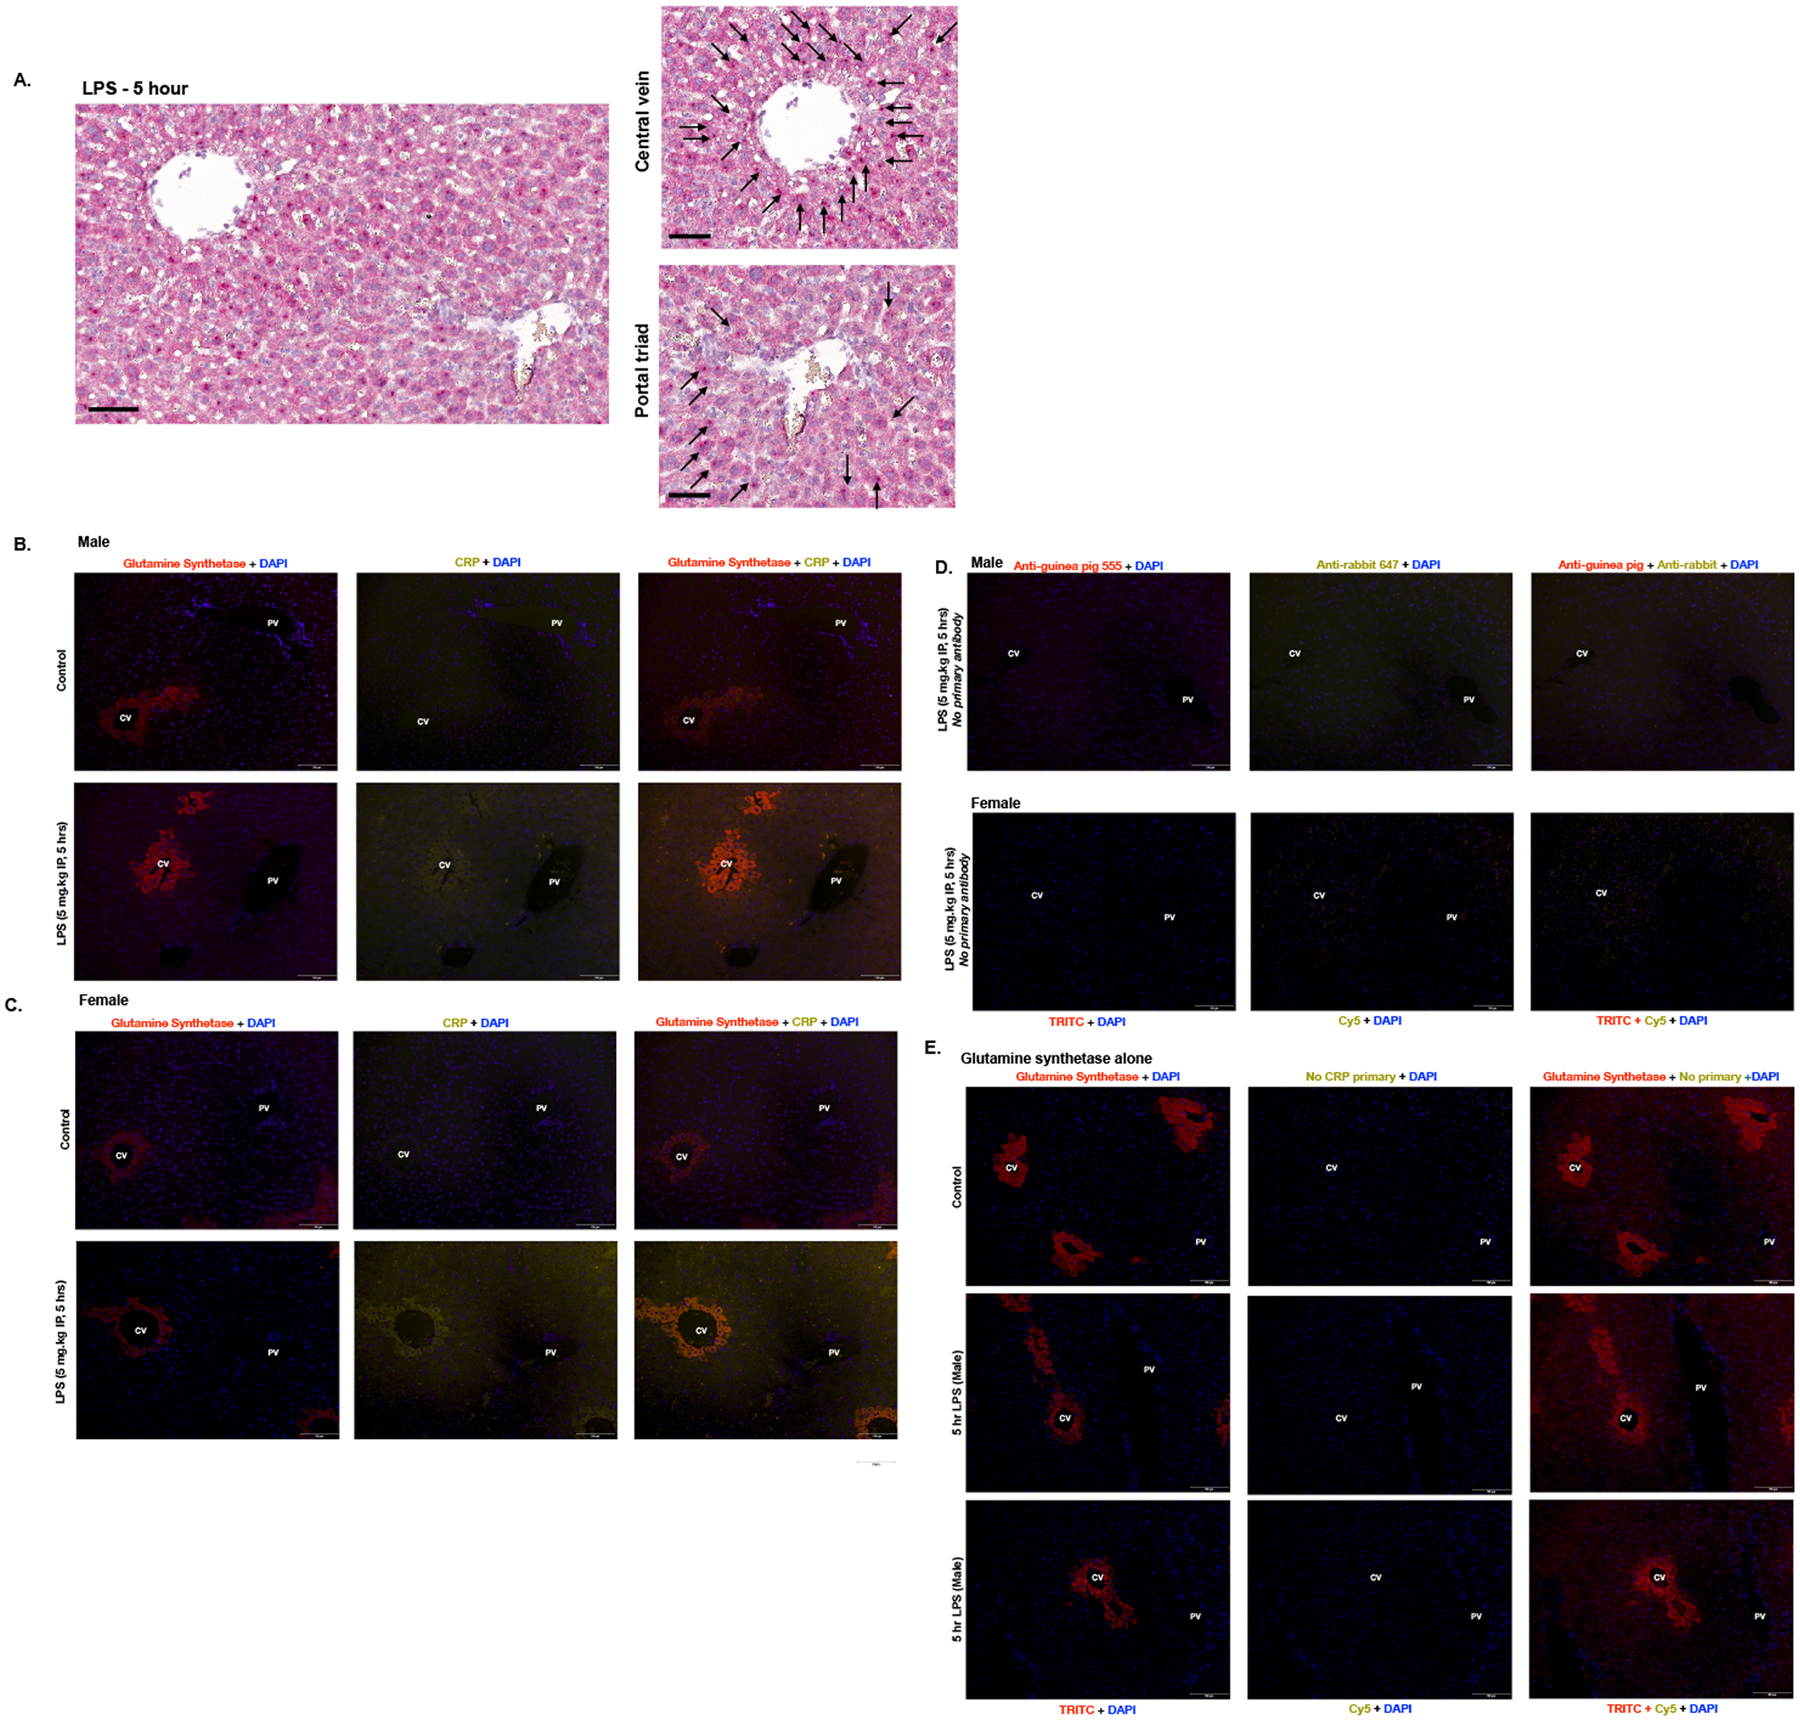
Figure 4. Endotoxemia induces CRP protein expression in pericentral hepatocytes.

(A) In situ hybridization RNAScope with Crp (red) of hepatic specimens from endotoxemic (LPS 5 mg/kg, IP; 5 hours) mice. Black arrowheads depict positive staining cells. First image includes a portal trial and central vein, followed by zoomed in images of the portal triad and central vein. The black bar measures 60μm. (B-C) Immunofluorescent staining of hepatic tissue from (B) male and (C) female mice with glutamine synthetase (red) + DAPI nuclear stain (blue) in the Column 1; CRP (yellow) + DAPI (blue) in the Column 2; and an overlay of all three channels in the Column 3. Row 1: Hepatic tissue from PBS exposed mice. Row 2: Hepatic tissue from endotoxemic (LPS 5 mg/kg IP, 5 hours) mice. Central veins (CV) are located on the left and portal veins (PV) are on the right of each image. Scale bar is 100 μm. (D) Hepatic tissue from male (Row 1) and female (Row 2) endotoxemic (LPS 5 mg/kg IP, 5 hours) mice stained with DAPI and secondary antibody but without primary antibodies. (D) Immunofluorescent staining of hepatic tissue from control male (Row 1), endotoxemic (LPS 5 mg/kg IP, 5 hours) male (Row 2 and 3), with glutamine synthetase (red) + DAPI nuclear stain (blue) in Column 1; No CRP primary (yellow) + DAPI (blue) in the Column 2, and an overlay of all three channels in Column 3. Central veins (CV) are labeled on the left and portal veins (PV) are on the right of each image. Scale bar is 100 μm.
