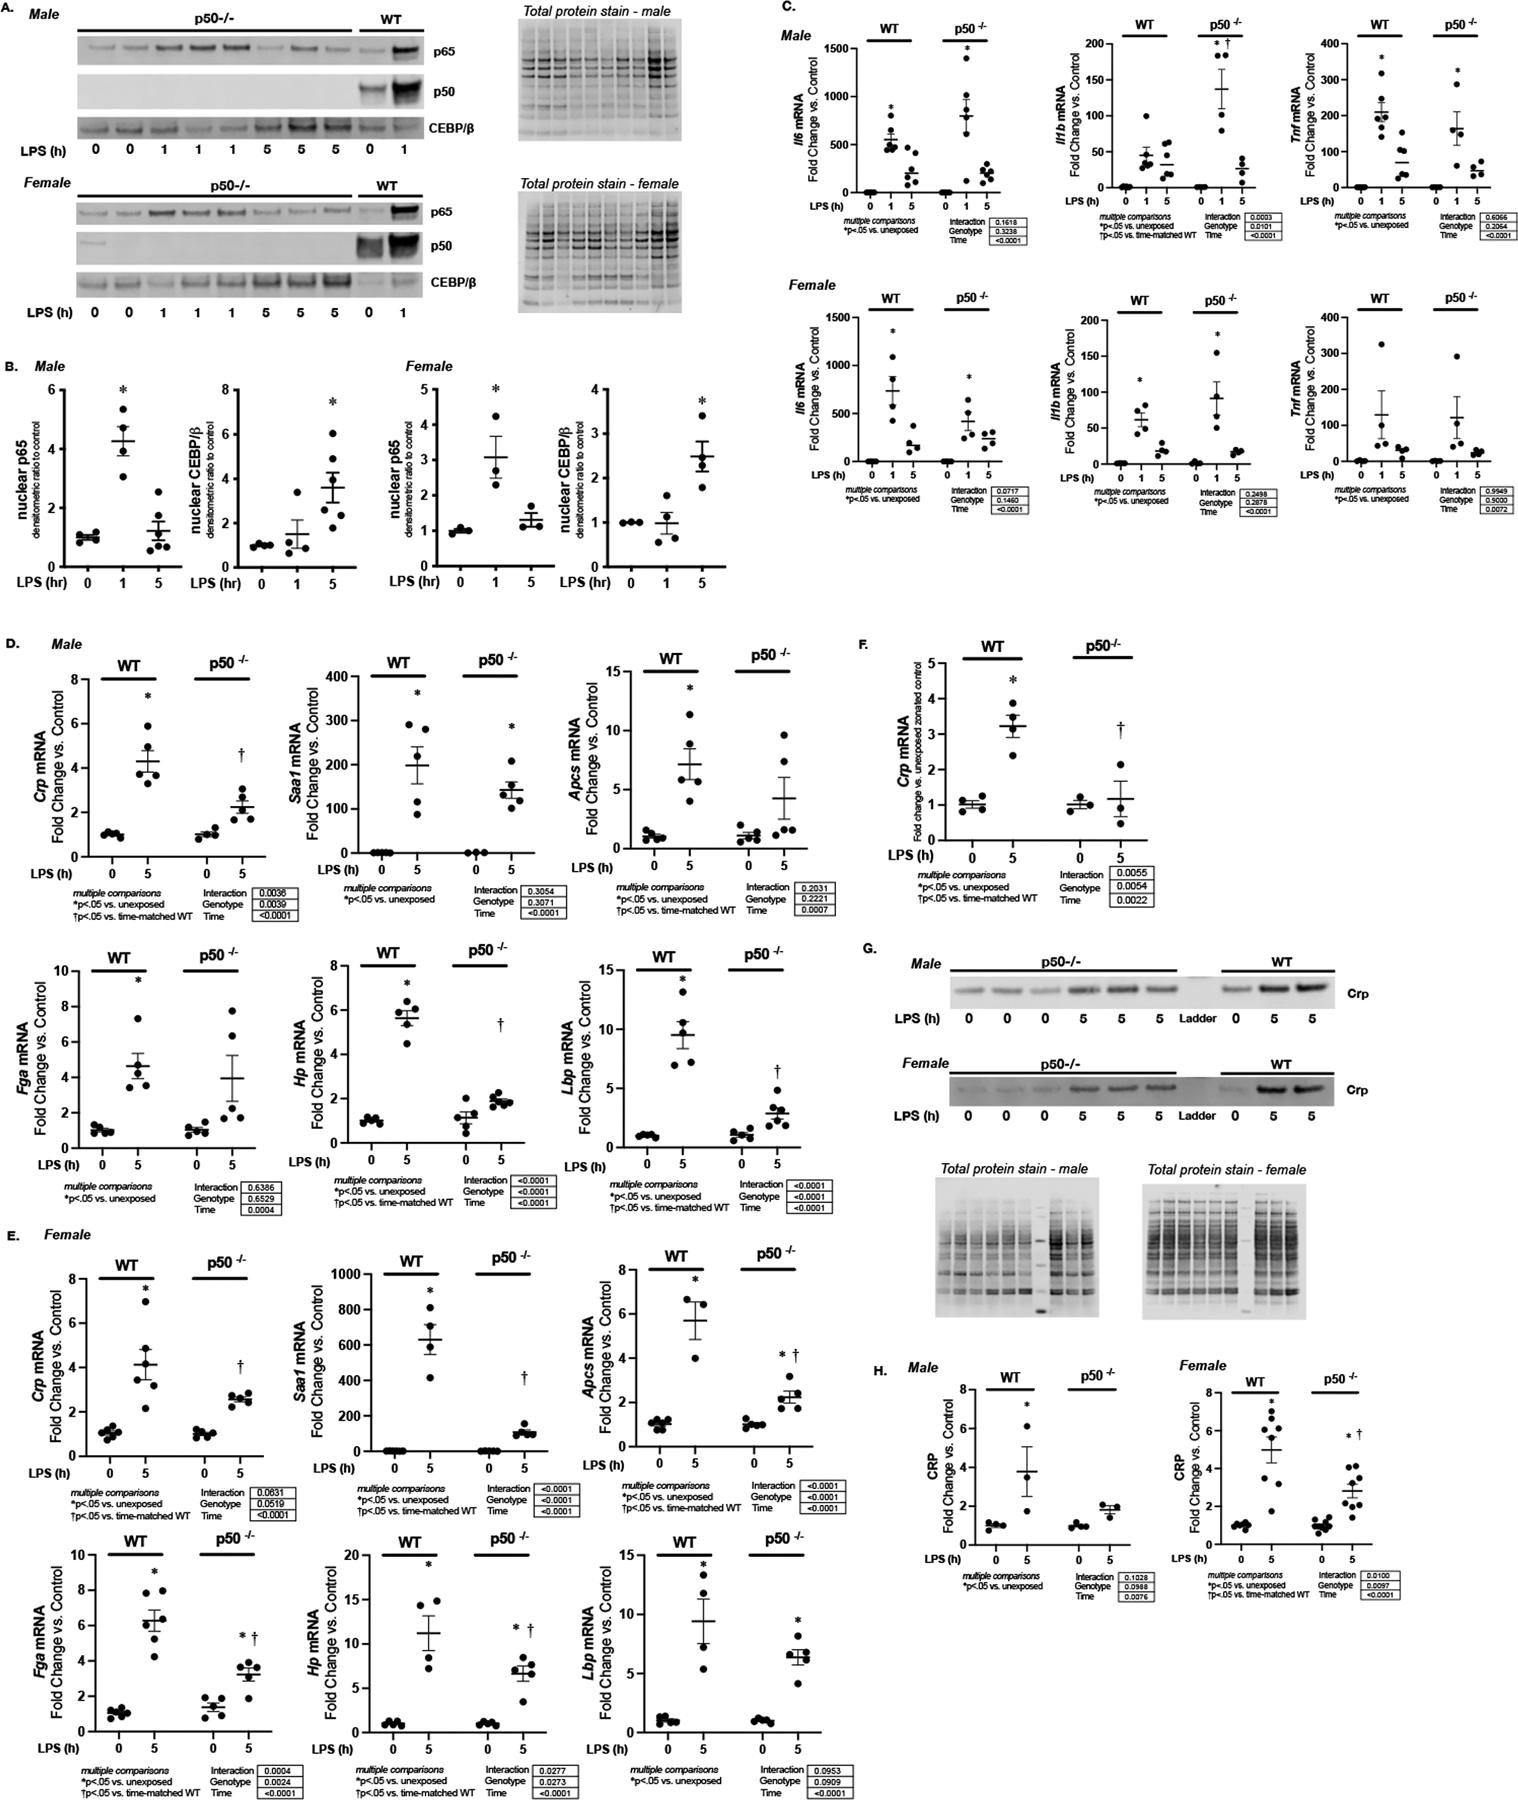
Figure 8. Endotoxemia induced APR is attenuated in p50−/− mice.

Representative Western blot of p65, p50 and CEBP/β on hepatic nuclear extracts isolated from endotoxemic (LPS 5 mg/kg, IP; 1 and 5 hours) male and female p50−/− mice. Total protein stain as loading control. Samples from WT control and endotoxemic (LPS 5 mg/kg, IP; 1 hour) male mice used as a positive control. (B) Densitometric analysis of nuclear p65, p50 and CEBP/β. Data normalized to total protein and expressed as mean ± SEM (N = 3–5 per time point). *p < 0.05 vs. unexposed control. (C) Fold change in liver mRNA expression of Il6, Il1b, and Tnf, isolated from endotoxemic (LPS 5 mg/kg, IP; 5 hours) male and female wildtype and p50−/− mice. Data expressed as mean ± SEM (N = 4–6 per time point). Results of 2way ANOVA for interaction, genotype and time provided. Results of multiple comparisons given, with *p<.05 vs. genotype-matched unexposed control. †p<.05 vs. time-matched similarly exposed WT. h = hours. (D-E) Fold change in liver mRNA expression of Crp, Saa-1, Apcs, Fga, Hp, and Lbp, isolated from endotoxemic (LPS 5 mg/kg, IP; 5 hours) (C) male and (D) female wildtype and p50−/− mice. Data expressed as mean ± SEM (N = 4–6 per time point). Results of 2way ANOVA for interaction, genotype and time provided. Results of multiple comparisons given, with *p<.05 vs. genotype-matched unexposed control. †p<.05 vs. time-matched similarly exposed WT. h = hours. (F) Fold change in Crp mRNA in pericentral (PC) hepatocytes isolated from endotoxemic (LPS 5 mg/kg, IP; 5 hours) WT and p50−/− mice. Data expressed as mean ± SEM (N = 3–4 per time point). Results of 2way ANOVA for interaction, genotype and time provided. Results of multiple comparisons given. *p < 0.05 vs. unexposed zone-matched control. †p < 0.05 vs. PC hepatocytes isolated from similarly exposed WT animals. h = hours. (G) Representative Western blot of CRP of hepatic cytoplasmic protein extracts isolated from endotoxemic (LPS 5 mg/kg, IP; 1 and 5 hours) male and female p50−/− mice. Total protein stain as loading control. (H) Densitometric analysis of cytoplasmic CRP. Data normalized to total protein and expressed as mean ± SEM (N = 3–5 per time point). Results of 2way ANOVA for interaction, genotype and time provided. Results of multiple comparisons given, with *p<.05 vs. unexposed †p<.05 vs. time-matched similarly exposed WT animals. h = hours.
