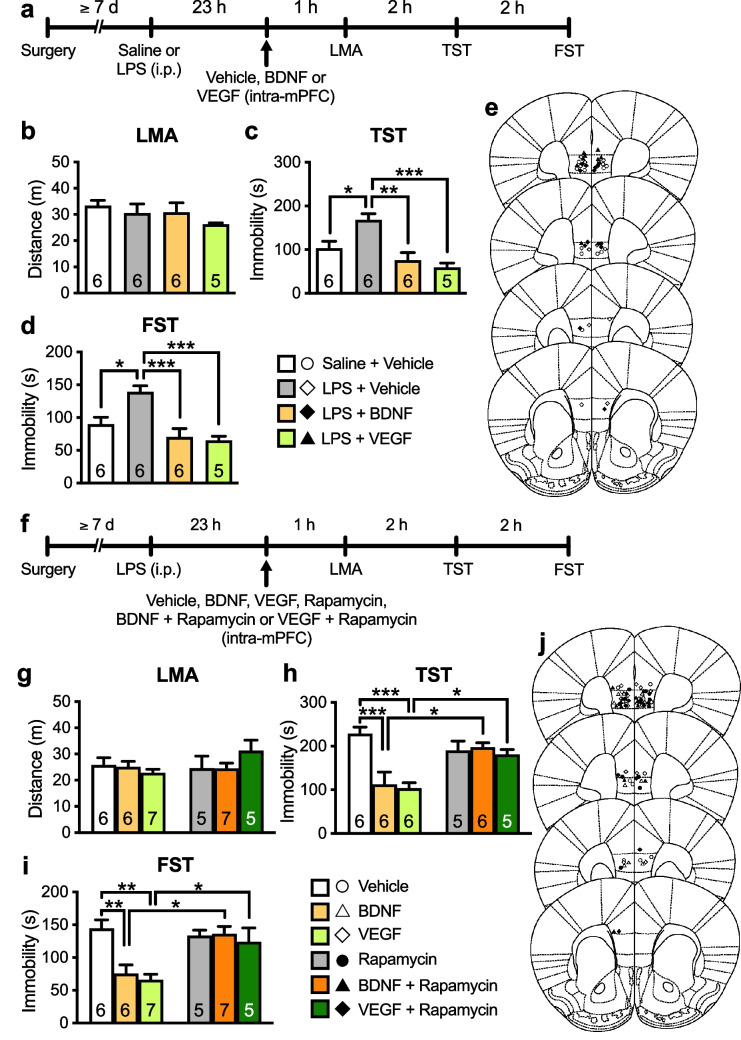
Fig. 5.
Intra-mPFC infusion of BDNF or VEGF produces antidepressant-like effects via mTORC1 activation in LPS-induced depression model mice. a The experimental timeline for LPS challenge (0.8 mg/kg, i.p.), intra-mPFC infusion of vehicle (0.1% BSA/PBS), BDNF (100 ng/side) or VEGF (5 ng/side), and behavioral testing. b–d Effects of intra-mPFC infusion of BDNF or VEGF on LMA (b, one-way ANOVA, F3,19 = 1.01, p = 0.411) and immobility time in the TST (c, one-way ANOVA, F3,19 = 10.1, p = 0.0003) and FST (d, one-way ANOVA, F3,19 = 10.7, p = 0.0002) in LPS-challenged mice. e Schematic representation of the mPFC infusion sites. Plates are from ref. 36. f The experimental timeline for LPS challenge (0.8 mg/kg, i.p.), intra-mPFC infusion of vehicle (10% DMSO/0.09% BSA/PBS), BDNF (100 ng/side), VEGF (5 ng/side), rapamycin [0.01 nmol/side; a mechanistic target of rapamycin complex 1 (mTORC1) inhibitor], BDNF + rapamycin or VEGF + rapamycin, and behavioral testing. g–h Effects of intra-mPFC infusion of BDNF or VEGF with or without rapamycin on LMA (g, interaction, F2,30 = 1.86, p = 0.171; rapamycin, F1,30 = 0.975, p = 0.331; BDNF and VEGF, F2,30 = 0.377, p = 0.689) and immobility time in the TST (h, interaction, F2,28 = 7.47, p = 0.0025; one VEGF- and one BDNF + rapamycin-treated mice were excluded due to tail-climbing) and FST (i, interaction, F2,30 = 4.86, p = 0.0149) in LPS-challenged mice. j Schematic representation of the mPFC infusion sites. Plates are from ref. 36. Data are expressed as mean ± SEM. *p < 0.05, **p < 0.01, ***p < 0.001 (b–d, one-way ANOVA; g, h, two-way ANOVA followed by Holm-Sidak’s post hoc test)

