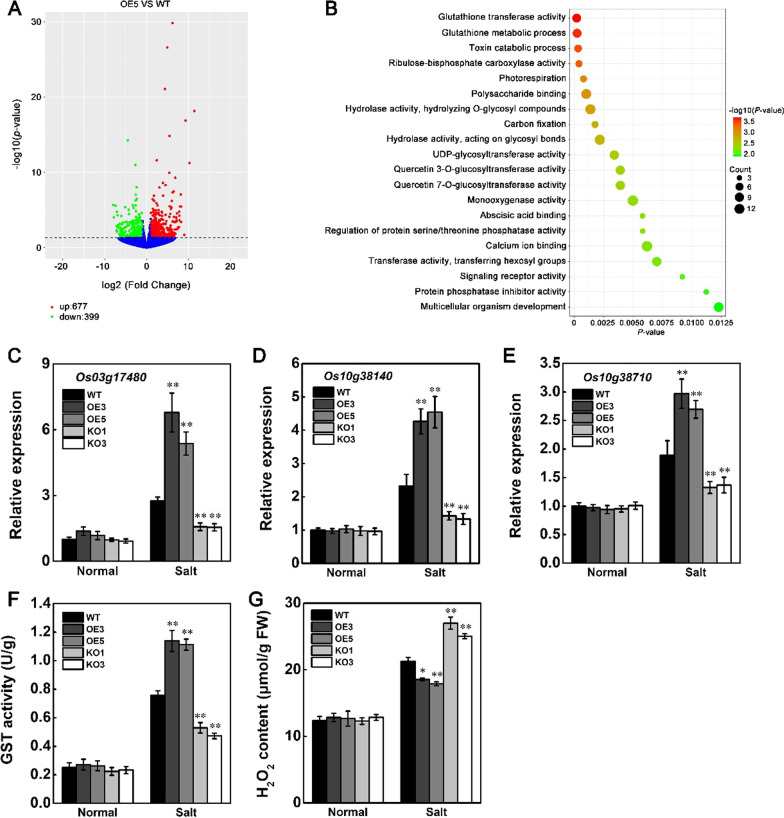
Fig. 7.
Differentially expressed genes (DEGs) in the STK-OE plants. A Volcano plots comparing the transcriptomes of OE5 plants with the WT. X-axis and Y-axis represent log2 fold change (FC) and − log10 (p-value), respectively. The green and red dots represent downregulated DEGs and upregulated DEGs, respectively. The blue dots represent no significant difference in transcriptomes. B Gene ontology (GO) enrichment analysis of DEGs. TOP 20 significantly enriched biological process GO terms are show. Three biological replicates were included for each treatment. C–E Relative expression of GST genes Os03g17480 (C) Os10g38140 (D) and Os10g38710 (E) in rice leaves of seedlings grown under normal conditions or after 150 mM NaCl for 48 h. F GST activity in rice leaves of seedlings grown under normal conditions or after 150 mM NaCl for 48 h. G H2O2 contents in rice leaves of seedlings grown under normal conditions or after 150 mM NaCl for 48 h. Data in (C–G) are presented as mean ± SD (n = 3, *P ≤ 0.05, **P ≤ 0.01, Tukey’s test)

