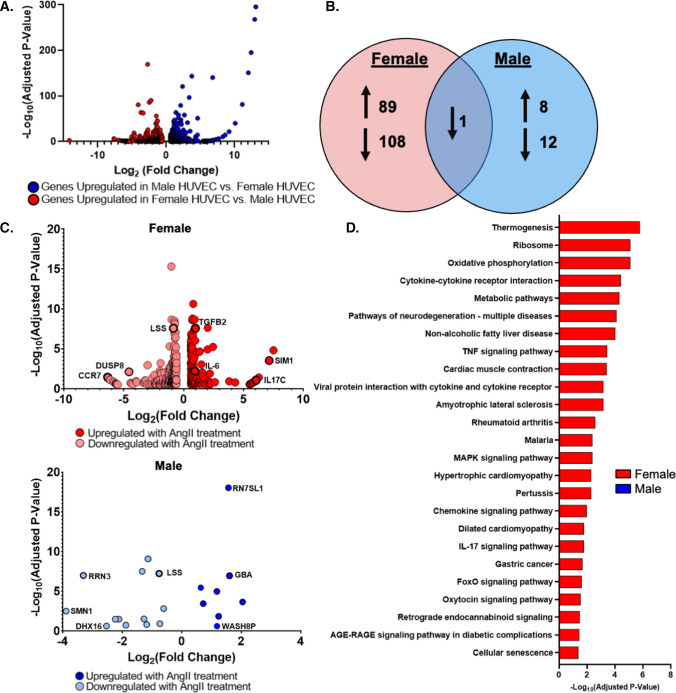
Fig. 1.
Female EC differentially expressed more genes in response to AngII treatment. A Volcano plot of RNA sequencing data from untreated pooled female and male HUVEC. Blue indicates genes upregulated in male vs. female HUVEC (512 genes), and red indicates genes upregulated in female vs. male HUVEC (622 genes). Graph demonstrates data relative to male HUVEC where a positive Log2FC indicates upregulation in male HUVEC and a negative Log2FC indicates downregulation in male HUVEC relative to female. B Venn Diagram of gene expression changes in pooled female and male HUVEC treated with 1 µM AngII for 24 h. C Volcano plots of genes that were differentially expressed following 24 h of AngII treatment in female and male HUVEC. A full table of all differentially expressed genes is in the supplemental data, and gene names are defined in the glossary. D KEGG pathways significantly altered by AngII treatment containing more than three differentially expressed genes. Significant with Log2FC > 0.6, and adjusted p-value < 0.3. n = 3 samples for each condition from pooled HUVEC in RNA sequencing data. Female and male HUVEC were pooled from three donors per sex

