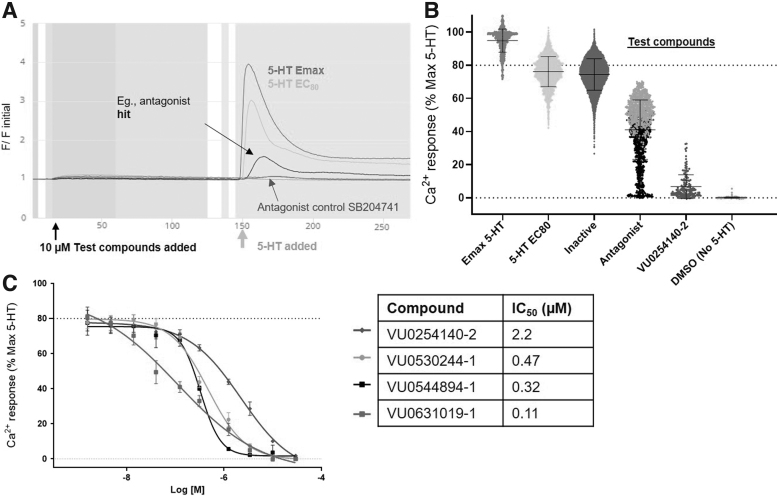
Fig. 2.
Results of screening HEK-5-HT2B cells.. (A) Example traces from the calcium assay showing representative wells of a 384-well screen plate over time (s); test compound addition (14 s), 5-HT stimulation (147 s). Fluorescence values are normalized as a ratio of initial value at time 0 s (F/F initial). Control maximal response of serotonin (“5-HT Emax”), EC80 stimulation with 5-HT (“5-HT EC80”), example hit compound, antagonist control, SB204741 (VU0254140-2). (B) Screening results of 24,592 small molecules shown as individual well values in presence of EC80 5-HT, unless otherwise indicated. Values normalized to percentage of maximal 5-HT response. Putative antagonist hit candidates identified as values decreasing 3SD or 3MAD below the mean or median response per 384-well plate tested. Five hundred seventy-six hits have completed testing in duplicate and confirmed hits have undergone CRCs. Additional 631 antagonist hits have not been further tested. Additional hits not shown: putative agonists (206) identified as increasing calcium response 3SD or 3MAD above mean or median before stimulation with 5-HT as well as other undesignated hits or flagged as fluorescent (78) were identified. (C) Selected antagonist candidates measured in triplicate compared with control antagonist VU0254140-2; all activity shown in presence of EC80 5-HT and values normalized to maximal 5-HT response. Values are mean and SD (n = 3) modeled with four parameter logistic curve-fitting, least squares regression (GraphPad Prism v.9.2). CRCs, concentration response curves; MAD, median absolute deviation; SD, standard deviation.

