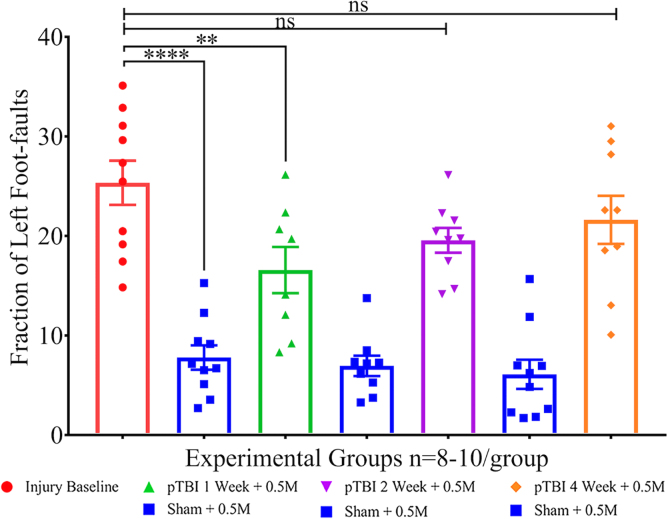
FIG. 4.
Scatterplot shows left foot-faults as percentage of total steps (y-axis) and experimental groups (x-axis). One-way ANOVA (F6,58 = 20.51), followed by Sidak's multiple comparisons post hoc test of the group mean foot-faults, shows a significant difference between sham (blue) and injury baseline (red), indicative of a robust injury effect (p < 0.0001). Injury baseline versus group 2 (green) was significant (p = 0.0077), albeit to a much lesser extent, and non-significant (ns) with group 4 (p = 0.15; ns) and group 6 (p = 0.64; ns), suggesting a modest amelioration of motor deficit. ANOVA, analysis of variance; ns, not statistically significant; pTBI, penetrating traumatic brain injury.

