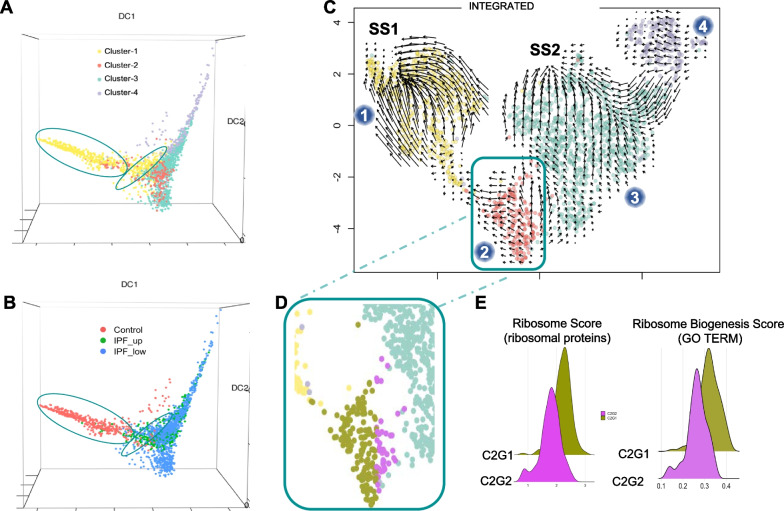
Fig. 7.
Pseudotime analysis of fibroblasts. RNA trajectory analysis shows (A) two distinct cell subgroups (ovals) in Cluster-1 (B) depending on the cell origin (control or IPF). Overall, the majority of the cells follow a pseudotime trajectory suggesting a phenotypic transition from Cluster-1 to Cluster-2 to Cluster-3 and finally Cluster-4 (arrow). C Velocity analysis of all fibroblasts suggests that Cluster-1 fibroblasts independently of their origin tend to reinstate their “normal/healthy” steady state (SS1). Fibroblasts from Cluster-3 tend to acquire a second steady state (SS2) which is distinctively different from the “normal” steady state. Blue dots indicate cluster number. D Cluster-2 fibroblasts can be divided into two sub-groups according to their velocity: one tending towards SS1 (C2G1, gold) and one towards SS2 (C2G2, magenta). E Histograms showing a ribosome score based on differentially expressed ribosomal protein genes in our dataset and a ribosome biogenesis score based on the expression of all GO genes associated with this process

