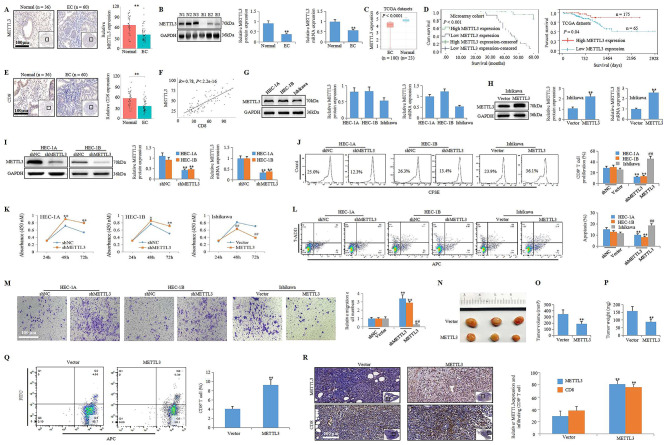
Fig. 1.
METTL3 inhibits EC by promoting immunosurveillance. A The endometria from endometrial tissues microarray cohort was subjected to IHC analysis to determine METTL3 level (scale bar: 100 μm; **P < 0.01 vs. Normal group). B The protein and mRNA expressions of METTL3 in endometria from normal subjects and EC patients (n = 3, **P < 0.01 vs. Normal group). C METTL3 expression in EC form TCGA datasets (****P < 0.0001 vs. Normal group). D Kaplan-Meier curves of correlation of METTL3 with the EC cumulative survival from endometrial tissues microarray cohort (P = 0.04) and TCGA datasets (P < 0.001). E The endometria from endometrial tissues microarray cohort was subjected to IHC analysis to determine CD8 level (scale bar: 100 μm; **P < 0.01 vs. Normal group). F Expression correlation between METTL3 and CD8 in endometrial tissues microarray cohort by Pearson correlation analysis (R = 0.78, P < 2.2e-16). G The protein and mRNA expressions of METTL3 in HEC-1 A, HEC-1B, and Ishikawa cell. H The protein and mRNA expressions of METTL3 in Ishikawa cell with or without METTL3 overexpression (**P < 0.01 vs. Vector group). I The protein and mRNA expressions of METTL3 in HEC-1 A and HEC-1B cell with or without shMETTL3 (**P < 0.01 vs. shNC group). J The proliferation of CD8+ T cell in co-cultured system (**P < 0.01 vs. shNC group, ##P < 0.01 vs. Vector group). K The proliferation of HEC-1 A, HEC-1B, and Ishikawa cell in co-cultured system (*P < 0.05 vs. shNC group, **P < 0.01 vs. shNC group, ##P < 0.01 vs. Vector group). L The apoptosis of HEC-1 A, HEC-1B, and Ishikawa cell in co-cultured system (**P < 0.01 vs. shNC group, ##P < 0.01 vs. Vector group). M The migration of HEC-1 A, HEC-1B, and Ishikawa cell in co-cultured system (scale bar: 100 μm; **P < 0.01 vs. shNC group, ##P < 0.01 vs. Vector group). N Representative images of xenograft tumors in BALB/C female mice by Ishikawa cell transfected with or without METTL3 overexpression. O Average tumor volume of BALB/C female mice (**P < 0.01 vs. Vector group). P Average tumor weight of BALB/C female mice (**P < 0.01 vs.vector group). Q Frequency of CD8+ T cell in the peripheral blood of BALB/C female mice (**P < 0.01 vs. Vector group). R IHC staining of METTL3 and CD8 in solid tumor of BALB/C female mice (scale bar: 100 μm; **P < 0.01 vs. Vector group)

