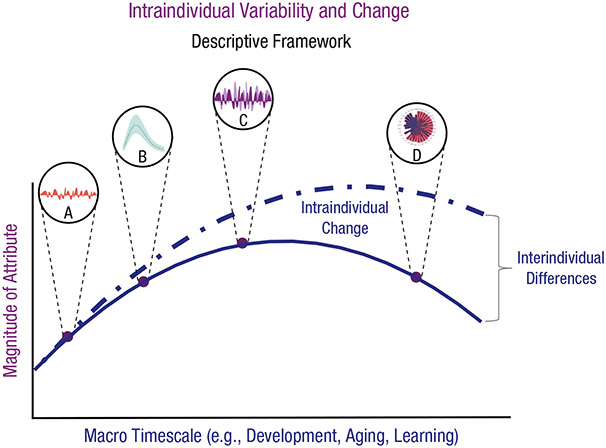
Fig. 1.
A visual representation of resilience operating across different timescales, including both short-term dynamics (intraindividual variability) and long-term changes (intraindividual change). Dynamic resilience processes are characterized as intensive “bursts” of measurements and depicted in magnified circles A (dampened reactivity), B (accelerated recovery), C (toughness/inoculation), and D (richness/balance). The solid line connecting the bursts represents long-term intraindividual-change processes (e.g., development) that accrue with advancing age. The dashed line indicates each person’s mean level of the attribute. Figure based on figures in Nesselroade (1991b), Ram and Gerstorf (2009), and Benson and Ram (2018).

