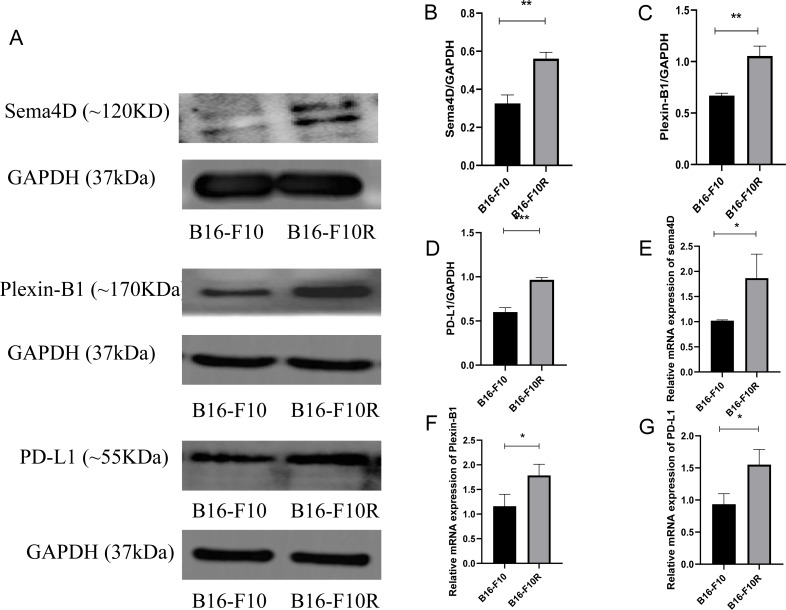
Figure 1. Sema4D, Plexin-B1 and PD-L1 expression in B16-F10 and B16-F10R cells.
Cells were derived into B16-F10R group (B16-F10R cells) and B16-F10 (B16-F10 cells), 24 h after cell culture, Sema4D, Plexin-B1 and PD-L1 expression were detected. (A) Protein bands of Sema4D, Plexin-B1 and PD-L1. (B) Ratio to GAPDH of Sema4D. Image J V1.8.0 software was used to measure the gray value of the value of the protein band, and then the relative density value was obtained by comparing the value of GAPDH with the target protein, p = 0.0026. (C) Ratio to GAPDH of Plexin-B1, p value = 0.0018. (D) Ratio to GAPDH of PD-L1, p value = 0.0016. (E) mRNA expression of Sema4D, p value = 0.037. (F) mRNA expression of Plexin-B1 , p = 0.0312. (G) mRNA expression of PD-L1, p = 0.0212. Compared with B16-F10 group, Sema4D and Plexin-B1 were significantly upregulated in B16-F10R group. ∗ is p < 0.05, ∗∗ is p < 0.01, ∗∗∗ is p < 0.001. Repeat the experiment three times (n = 3), t test was used for statistical analysis.

