Figure 1.

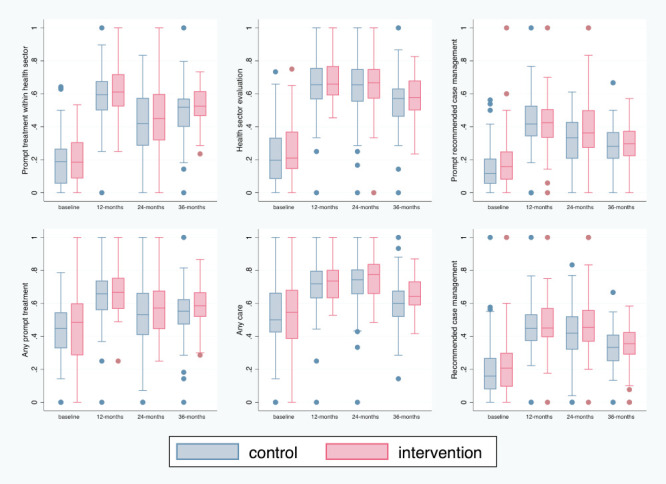
Box plots representing the variability in cluster summaries of the primary and secondary health care utilisation outcomes in intervention and control arms at each time point.

Box plots representing the variability in cluster summaries of the primary and secondary health care utilisation outcomes in intervention and control arms at each time point.