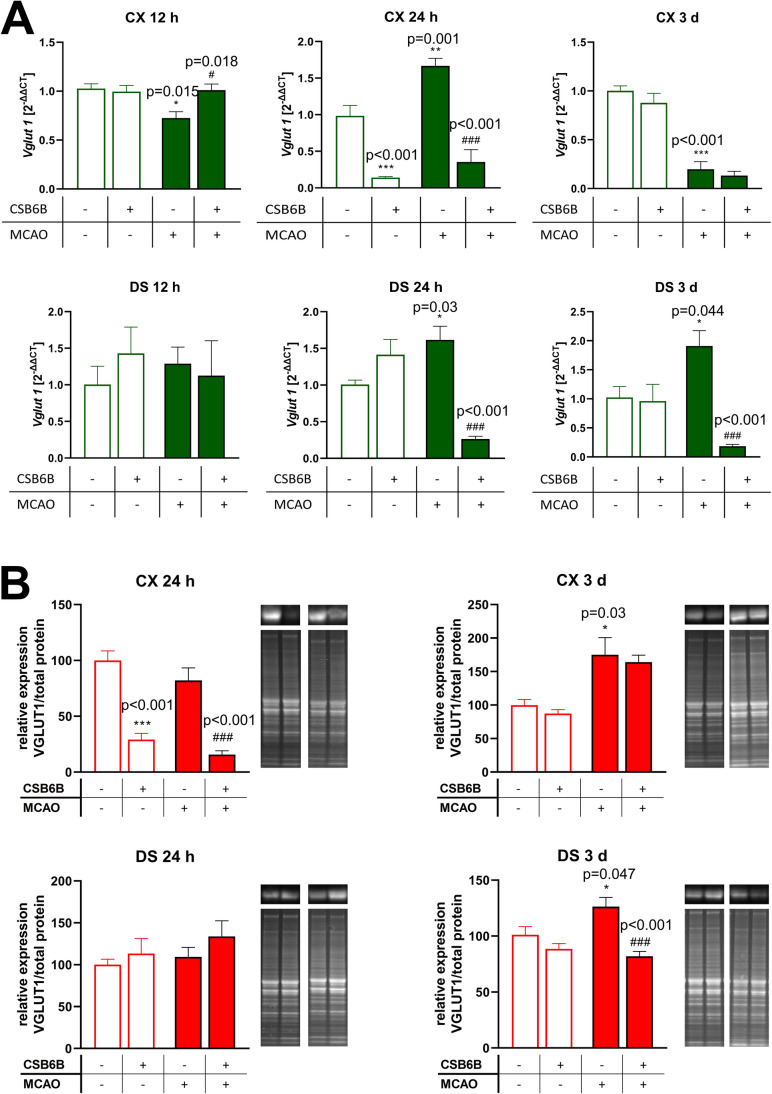
Fig. 2.
The effect of MCAO and CSB6B pretreatment on the expression of VGLUT1 mRNA (A) and protein (B) in the spatiotemporal context. A Results of RT-qPCR analysis of Vglut1 are expressed as the mean fold change of Vglut1 ± SEM (n = 6). Fold change was calculated using 2−ΔΔCt method and three reference genes, Ppia, Ywhaz, and Hprt. Results for each experimental group are related to SHAM group. B Western blot results of VGLUT1 protein expression were normalized against SHAM group for which the expression is equal to 100% and are expressed as the means ± SEM (n = 6). On the right of each graph, representative immunoblots are presented with reference to the total protein concentration. Due to large number of experimental groups, ischemic groups and sham-operated groups were analyzed on separate gels, however, at the same run, the same experimental conditions and moreover, an additional gel with MCAO and SHAM groups was analyzed. mRNA and protein data were analyzed using one-way ANOVA, followed by Sidak post hoc test (*p < 0.05, **p < 0.01, ***p < 0.001 for comparisons vs SHAM; #p < 0.05, ##p < 0.01 for comparisons vs MCAO)

