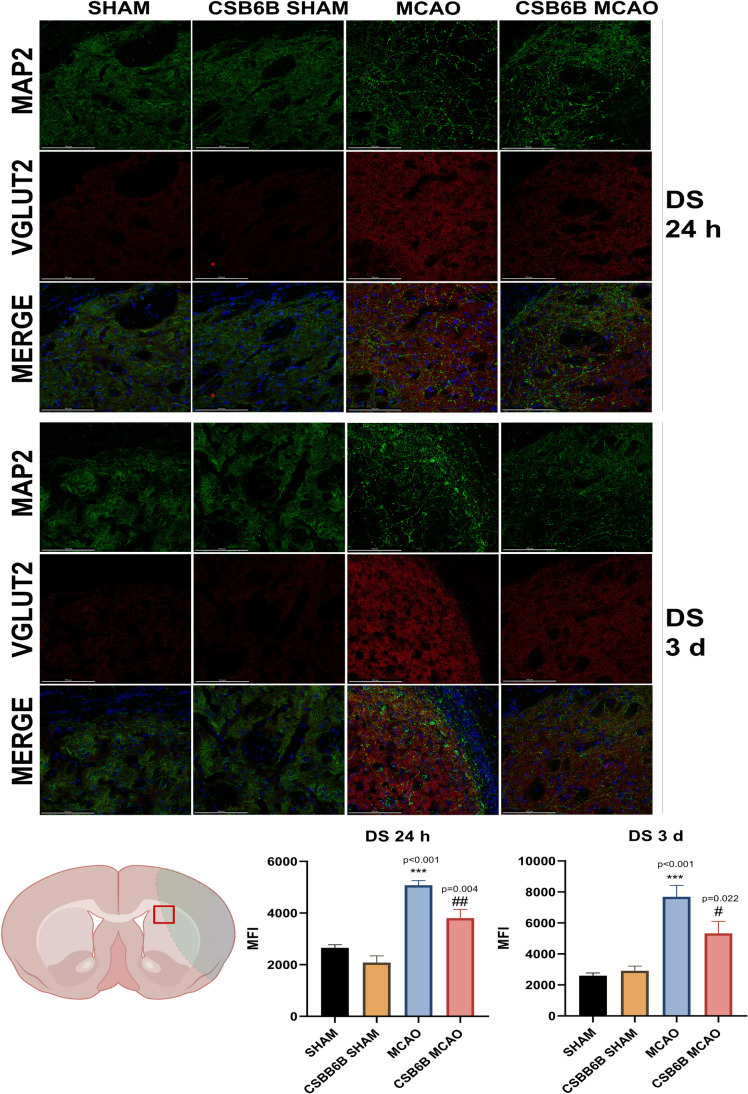
Fig. 7.
Expression of VGLUT2 in the dorsal striatum at 24 h and at 3 d after reperfusion. A total of 20 μm thick brain sections were double stained for MAP2 (green) and VGLUT2 (red). For each experimental group, n = 6 animals. Below on the left, on a brain diagram, the periinfarct area marked with red square indicates the location of performed analysis. Below on the right, the quantitative analysis of VGLUT2 mean fluorescence intensity (MFI). Data were analyzed with one-way ANOVA, followed by Sidak post hoc test (*p < 0.05, **p < 0.01, ***p < 0.001 for comparisons vs SHAM; #p < 0.05, ##p < 0.01 for comparisons vs MCAO). Scale bar = 100 µm

