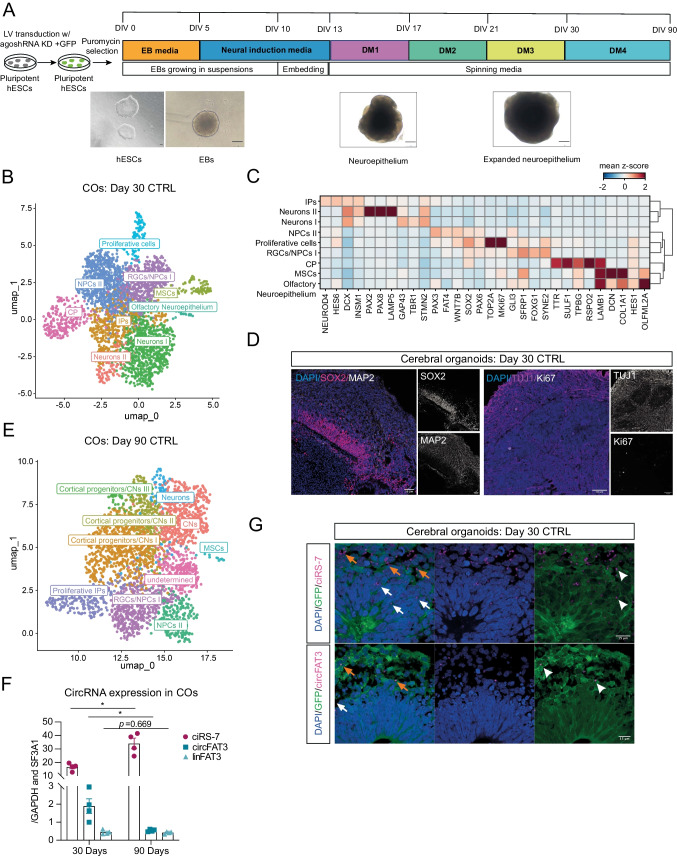
Fig. 3.
Establishment of cerebral organoids (COs) to study circRNA function during later stages of human brain development. A Generation of COs based on previous publications [36, 37]. After embryoid body (EB; DIV 2–5) generation from transduced and puromycin-selected hESCs, media was changed to neural induction media until day 13. EBs were grown in suspension for 10 days, before embedding them in Matrigel. From day 13, COs were cultured in spinning media. Differentiation media 1 (DM1) was supplemented with CHIR for 3 days [36]. After day 30, DM4 was additionally supplemented with BDNF, GDNF, cAMP, and TGFβ [37]. Differentiations were performed as two individual experiments. DIV, days in vitro; scale bar = 200 µm. B UMAP plot of scRNA-seq of day 30 CTRL COs (n = 2). Clustering of 3095 cells (with > 500 UMI) into nine clusters. NPCs, neural progenitor cells; RGCs, radial glial cells; IPs, intermediate progenitor cells; CPs, choroid plexus cells; MSCs, mesenchymal cells. C Heatmap of selected genes (depicted as mean z-score across cells within a cluster) characterizing the nine clusters identified in B. D IHC of day 30 CTRL COs. Upper panel: grey = MAP2, magenta = SOX2, blue = DAPI; Lower panel: pink = TUJ1, grey = Ki67. 12 µm cryostat sections; scale bar = 50 µm. E UMAP plot of scRNA-seq of day 90 CTRL COs (n = 2). Clustering of 2727 cells (with > 500 UMI) into nine clusters. F CiRS-7, circFAT3, and linear FAT3 levels in days 30 and 90 CTRL COs were determined via RT-qPCR. Plots show values as mean ± SEM. Mean (ciRS-7; day 30) = 16.7 ± 2.8; mean (ciRS-7; day 90) = 34.0 ± 7.7; mean (circFAT3; day 30) = 1.89 ± 0.82, mean (circFAT3; day 90) = 0.54 ± 0.06; mean (FAT3; day 30) = 0.45 ± 0.12 and mean (FAT3; day 90) = 0.42 ± 0.06; normalized to the mean of GAPDH and SF3A1; n = 4 from two CO batches; two-tailed unpaired t-test, *p < 0.05. G Cell nuclei were stained with DAPI (blue), cell cytoplasm GFP+ (green) through agoshRNA expression vector, and circRNA ISH (magenta). Upper panel: ciRS-7 probe. Lower panel: circFAT3 probe. White arrows indicate circRNA expression outside of germinal zone. Orange arrows indicate circRNAs within the germinal zone. White arrowheads showing subcellular localization of circRNAs. 12 µm cryostat sections; scale bar = 15 µm

