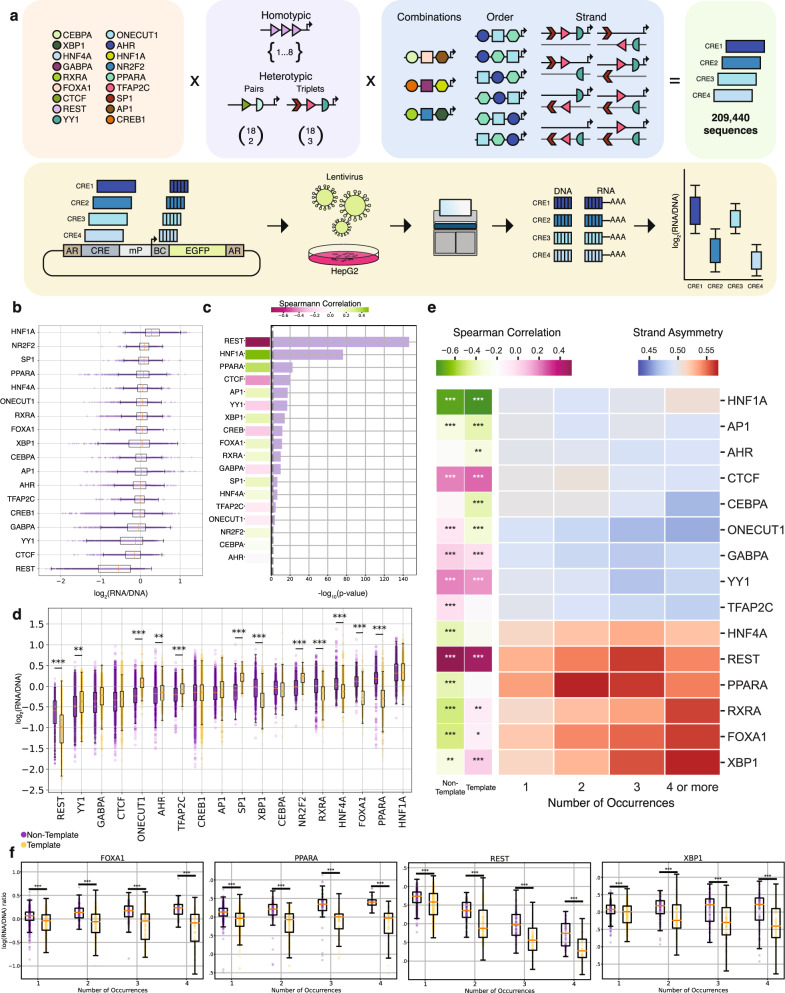
Fig. 1. Homotypic TFBS orientation effects on cis-regulatory activity.
a, Schematic of MPRA library design and workflow. Eighteen TFBSs, homotypic and heterotypic singlets, pairs and triplets were tested in all possible orientations and permutations. Homotypic TFBS insertions in the construct included 1-8 copies in either orientation and for heterotypic pairs and triplets permutations were tested in every TFBS orientation/combination. The lentiMPRA construct has a cis-regulatory element (CRE), minimal promoter (mP), barcode (BC), Enhanced Green Fluorescent Protein (EGFP) reporter and antirepressors (AR). Lentivirus was generated, cells infected and DNA and RNA barcodes sequenced. b, Expression levels of sequences harboring each TFBSs, for n = 2 background sequences. c, Barplot showing the -log(p-values) of the Spearman correlation between the number of occurrences and the mean expression values. Dotted gray line represents the threshold for Bonferroni corrected p-values of 0.05 (two-sided). Spearman correlation score is shown on the left. d, Expression levels for sequences with one or more TFBS occurrences at template or non-template orientation in yellow and purple, respectively, for n = 2 background sequences. Tiles contain non-template copies of TFBS or only template copies. Strand asymmetry was calculated as the ratio of the mean expression for sequences with TFBSs over both orientations (two-sided t-test and Bonferroni-corrected p-values). e, Heatmap showing the ratio of mean expression at the non-template over the template strand as a function of TFBS copy number. Spearman correlation between the number of occurrences and mean expression levels for TFBSs in the template and non-template shown as two-column heatmap (Spearman correlation with Bonferroni-corrected p-values (two-sided)). f, Association between expression levels and number of TFBS occurrences at the template and non-template orientation for REST, PPARA, FOXA1 and XBP1, for n = 2 background sequences (two-sided t-test and Bonferroni-corrected p-values). Adjusted p-values displayed as * for p-value<0.05, ** for p-value<0.01 and *** for p-value<0.001. In the boxplots, the median is indicated as the center line, the lower and upper limits are first quantile (25th percentile) and third quantile (75th percentile) respectively, the lower and upper whiskers are the lowest and maximum value of the data within 1.5 times the interquartile range over the 25th and the 75th percentile.

