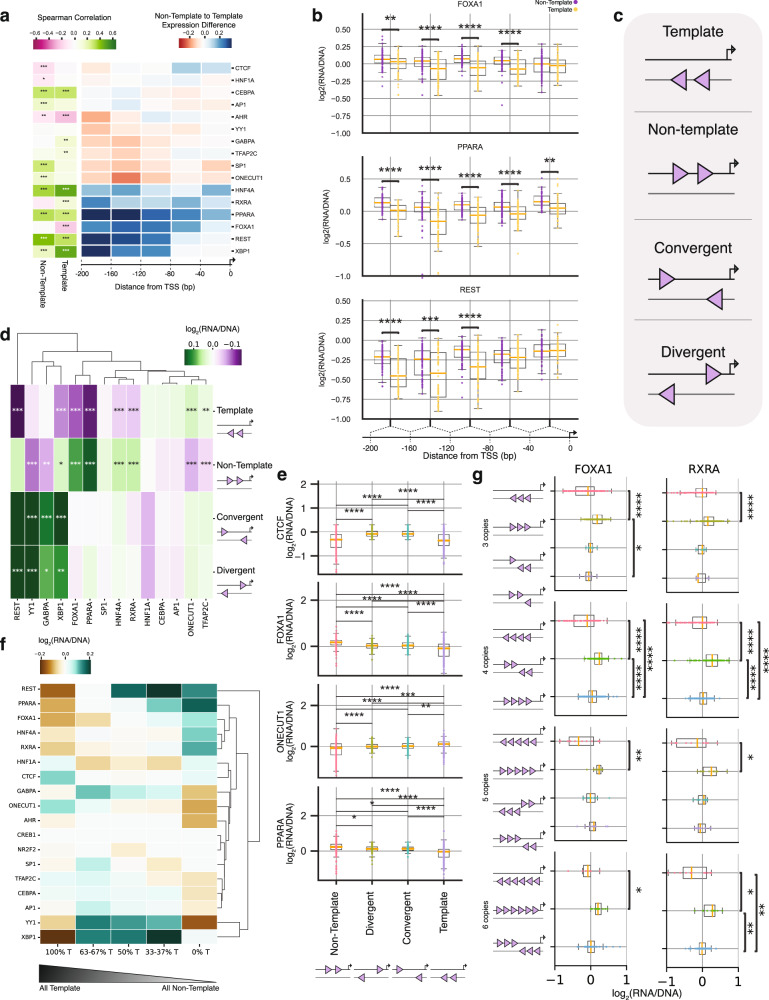
Fig. 2. Permutation and orientation effects of heterotypic TFBS pairs.
a, Heatmap showing the association between the distance in the MPRA tile (in bps) and expression levels for individual TFBSs. The Spearman correlation between distance and expression levels in TFBSs in the template, non-template and both template and non-template (combined) orientations is shown and the p-value was Bonferroni corrected. Non-template to template expression difference is shown as a function of distance from the transcription start site (TSS). b, Expression of PPARA, FOXA1 and REST TFBSs in the template and non-template orientation as a function of distance from TSS, for n = 2 background sequences. Statistical significance was calculated with a two-sided t-test and Bonferroni-corrected p-values. c, Schematic showing the four possible orientations for homotypic TFBS pairs: template, non-template, convergent and divergent. d, Heatmap showing the percent expression difference in each of the four possible orientations relative to the total expression levels. Statistical significance was estimated with two-sided t-test and Bonferroni-corrected p-values. e, Examples of CTCF, FOXA1, ONECUT1, PPARA, REST, YY1 and XBP1 displaying statistically significant bias in the expression between any two of the four possible orientations. Results obtained from n = 2 background sequences. f, The proportion of homotypic clusters of each TFBS in template and non-template orientation influences expression levels measured as fold-change from mean expression. Only TFBS for which sufficient barcodes were recovered are displayed. g, RXRA and FOXA1 expression difference between orientations for three, four, five and six copies. Results obtained from n = 2 background sequences. Adjusted p-values are displayed as * for p-value<0.05, ** for p-value<0.01 and *** for p-value<0.001. In the boxplots, the median is indicated as the center line, the lower and upper limits of the boxplots indicate the first quantile (25th percentile) and the third quantile (75th percentile) respectively, the lower and upper whiskers are the lowest and the maximum value of the data that are within 1.5 times the interquartile range over the 25th and the 75th percentile respectively.

