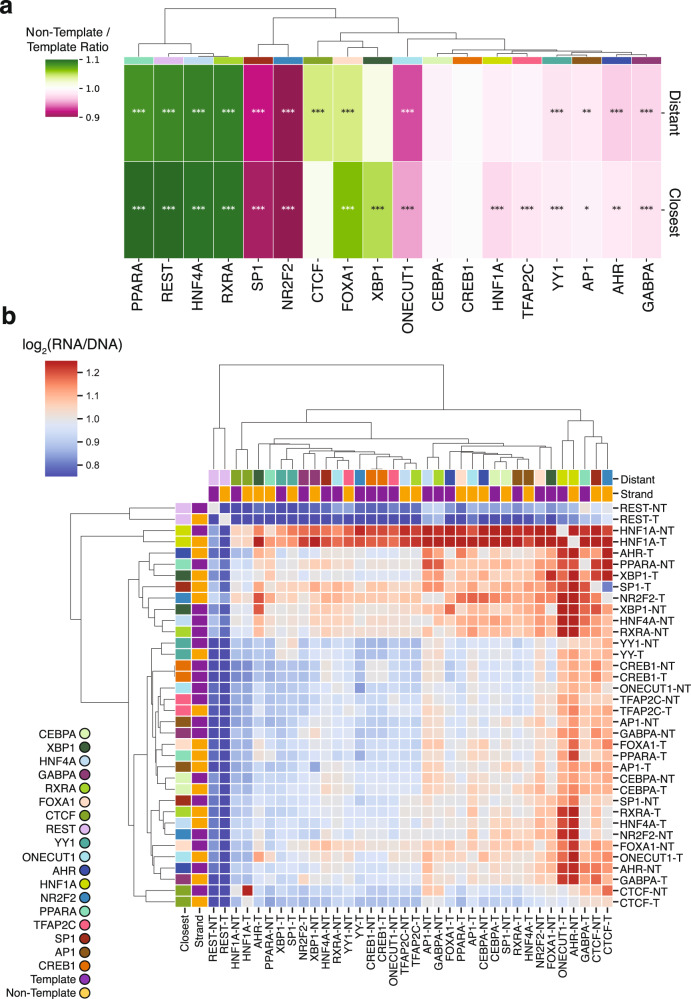
Fig. 4. The orientation and order of heterotypic TFBSs impacts expression levels.
a, Hierarchical clustering of TFBSs for each TFBS showing the mean non-template to template expression ratio. “Distant” refers to the TFBS being most distant relative to the TSS and “Closest” to the TFBS being closest to the TSS as part of the heterotypic TFBS pairs. Enrichment was estimated as the mean non-template to mean template expression. Statistical significance was estimated with two-sided t-test and Bonferroni corrections calculated between the template and non-template occurrences of each TFBS for “Closest” and “Distant” positions separately. b, Hierarchical clustering of TFBS pairs in the non-template (NT; purple) or template (T; yellow) orientation. The order of transcription factors is denoted with the most distant transcription factor relative to the TSS shown in the rows. In the first column, each color represents a different transcription factor. Adjusted p-values displayed as * for p-value<0.05, ** for p-value<0.01 and *** for p-value<0.001.

