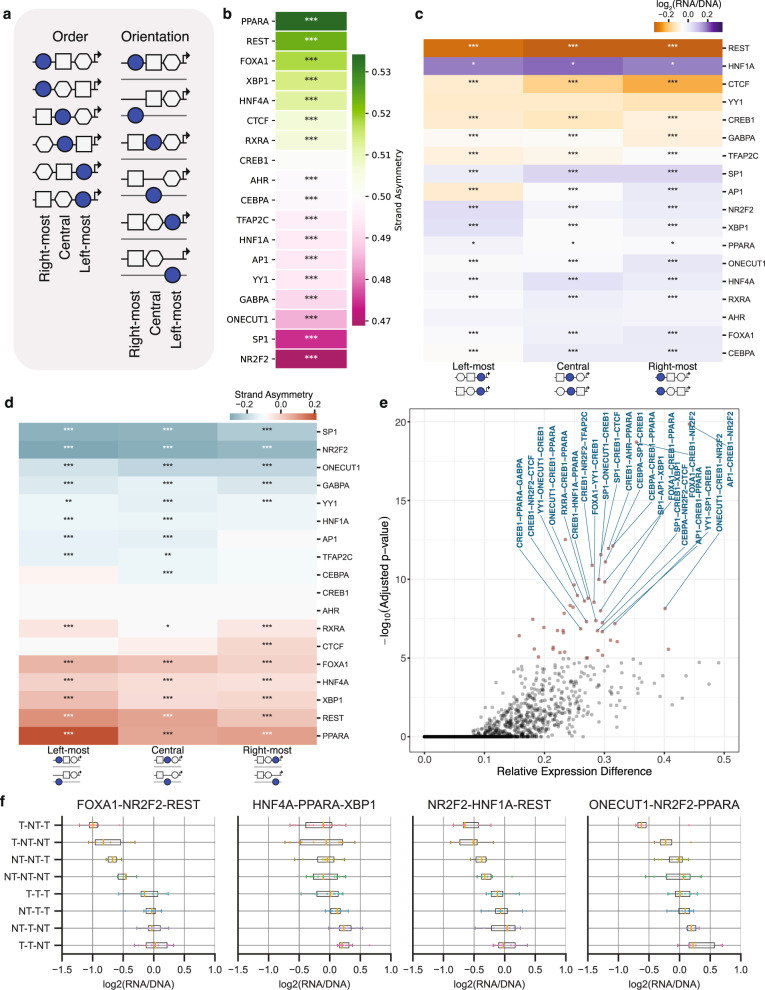
Fig. 5. The strand orientation and order of constituent TFBSs in TFBS clusters influences expression levels.
a, Schematic displaying the positions in which a TFBS can be found within a TFBS triplet, being the rightmost, middle or leftmost TFBS and in two possible orientations. For the TFBS triplet there are eight possible orientations and six different orders. b, Strand asymmetry in expression between the template and non-template orientations for each TFBS across the TFBS triplet clusters. Statistical significance was estimated with two-sided t-tests with Bonferroni-corrected p-values. c, The order of TFBSs in the TFBS triplet influences expression levels. Across TFBS triplets, we examined if the position of each TFBS influenced expression levels by comparing the expression levels between the occurrences of the TFBS in the left-most, central or right-most positions. Statistical significance was estimated with one-way ANOVA with Bonferroni correction. d, Strand asymmetry levels for each of the three positions in the TFBS triplet for each TFBS. Strand asymmetry was calculated here as the difference between the mean expressions for the TFBS at the non-template and template orientations across the TFBS triplets. e, The orientation of TFBSs influences expression, estimated with one-way ANOVA with Bonferroni-corrected p-values. f, Examples of TFBS triplets with all possible orientations of each TFBS presented. For each TFBS, NT represents non-template and T represents template in the order at which the transcription factor names are listed. Results obtained from n = 2 background sequences. Adjusted p-values displayed as * for p-value<0.05, ** for p-value<0.01 and *** for p-value<0.001. In the boxplots, the median is indicated as the center line, the lower and upper limits of the boxplots indicate the first quantile (25th percentile) and the third quantile (75th percentile) respectively, the lower and upper whiskers are the lowest and the maximum value of the data that are within 1.5 times the interquartile range over the 25th and the 75th percentile respectively.

