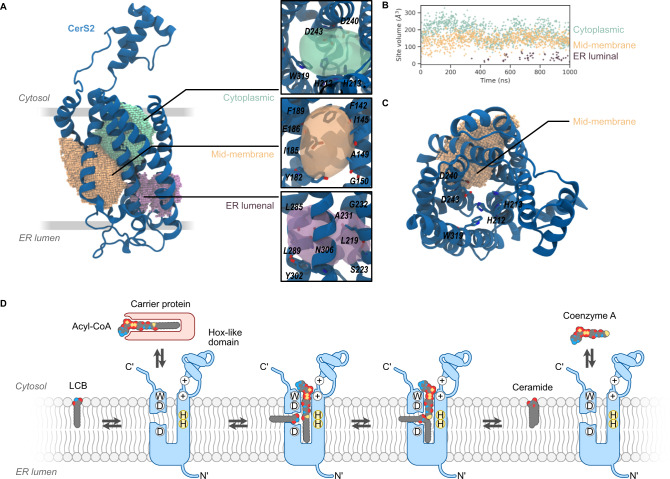
Fig. 3. MD simulations of CerS2 reveal putative binding pockets and suggest a working model for N-acyltransferase activity.
A The three pockets in the cytoplasmic (green), mid-membrane (orange), and ER lumen (purple) are shown as spheres based on SiteMap pocket predictions. The inset (right) depicts the position of the three pockets as translucent isosurfaces with selected residues labeled and shown as sticks with per-atom coloring. B Volume of pockets plotted versus time of simulation. Vertical axis shows cavity volume (Å3). Source data are provided as a Source Data file. C Vertical view of CerS2 with the mid-membrane pocket shown as spheres. Highly conserved residues lining the predicted active site are labeled. D Working model for CerS N-acyltransferase activity. The CerS active site accommodates an acyl-CoA, which is delivered from the cytoplasmic side of the ER membrane via acyl-CoA carrier proteins. Sphingoid bases access the active site via a side channel that accommodates the sphingoid motif but leaves the acyl tail free in the hydrophobic region of the bilayer. Acyl chain transfer is proposed to occur once both molecules are present in the active site, coordinated by the conserved double histidine motif. After ceramide synthesis, the product is released to the bilayer, while the free CoA is released to the cytoplasm. CerS in blue with N- and C-termini, and the Hox-like domain indicated. The position of the conserved tryptophan, aspartic acids, and histidine residues are indicated using one-letter codes, while positively charged residues are indicated with circled plus signs. The LCB, acyl-CoA, and ceramide are indicated with space-filling cartoons colored by atom type.

