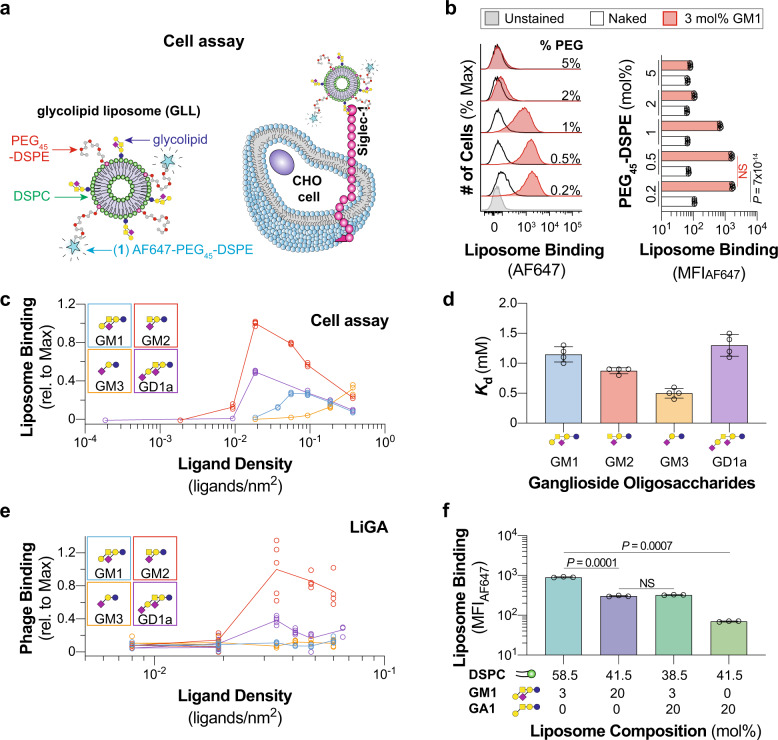
Fig. 1. Optimizing a liposome formulation for probing Siglec–ganglioside interactions.
a Schematic of the cell assay where binding between Siglec-1-expressing CHO cells and fluorescently labeled GLLs are quantified via flow cytometry. b Representative flow cytometry histograms and quantification of 3 mol% GM1 liposomes with varying mol% of PEG45–DSPE to Siglec-1 CHO cells (n = 5 technical replicates). c Binding of liposomes formulated with increasing ganglioside (GM1, GM2, GM3, GD1a) content against Siglec-1 CHO cells (n = 4 technical replicates). d Mass spectrometry-derived dissociation constant for the interaction between soluble Siglec-1 and ganglioside (GM1, GM2, GM3, GD1a) oligosaccharides (n = 4 technical replicates). e Ganglioside (GM1, GM2, GM3, GD1a) oligosaccharide density titration using a liquid glycan array (LiGA) against Siglec-1 CHO cells (5 ≥ n ≥ 4 technical replicates). f Liposomes formulated with GM1 and GA1 binding to Siglec-1-expressing CHO cells in the cell assay (n = 3 technical replicates). Glycan structures are represented using Symbol Nomenclature for Glycans (SNFG; blue circle, glucose; yellow circle, galactose; yellow square, GalNAc; purple diamond, Neu5Ac). Data are represented as the mean ± one standard deviation of at least three technical replicates. For panels b and f a Brown–Forsythe and Welch one-way ANOVA was used for statistical analysis. Not Significant (NS), P > 0.5.

