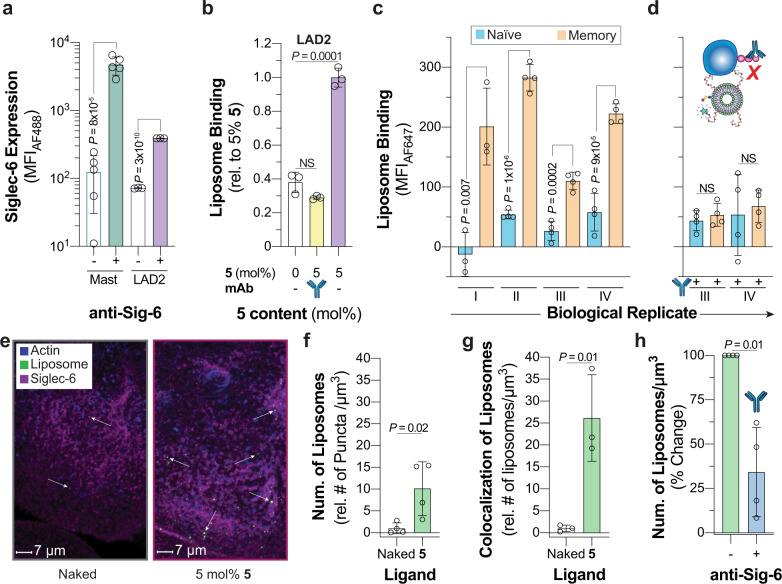
Fig. 5. Targeting Siglec-6 on human cells and tissues.
a Siglec-6 expression levels on primary mast cells isolated from healthy human spleen donors and LAD2 cells. For the primary mast cells, each datum represents a biological replicant (n = 5 biological replicates). b Binding of 5 nGLLs to LAD2 after treatment with an anti-Siglec-6 antibody quantified by flow cytometry (n = 3 technical replicates). c and d 5 liposome binding to human naïve and memory B-cells isolated from the blood of four healthy biological replicants (represented with Roman numerals) without and with pretreatment of Siglec-6 blocking antibody, respectively (4 ≥ n ≥ 3 technical replicates). e Representative confocal microscopy images of human syncytiotrophoblasts after treatment with naked and 5 nGLLs. Quantification of the total number of naked liposomes and 5 nGLLs binding to human placental explants per µm3 (f n = 4 biological replicates) and the number of 5 nGLL colocalized with Siglec-6 per µm3 (g n = 3 biological replicates). h Binding of 5 nGLLs to human syncytiotrophoblasts after treatment with an anti-Siglec-antibody (n = 3 biological replicates). For panels f, g, and h each datum is representative of a different donor, which introduces variability between panels. All results are represented by the mean ± one standard deviation of at least three technical replicates. For panels a, c, d, f, g, and h, a two-tailed Student’s t-test was used for statistical analysis. For panel b, a Brown–Forsythe and Welch one-way ANOVA was used for statistical analysis. Not Significant (NS) P > 0.5.

