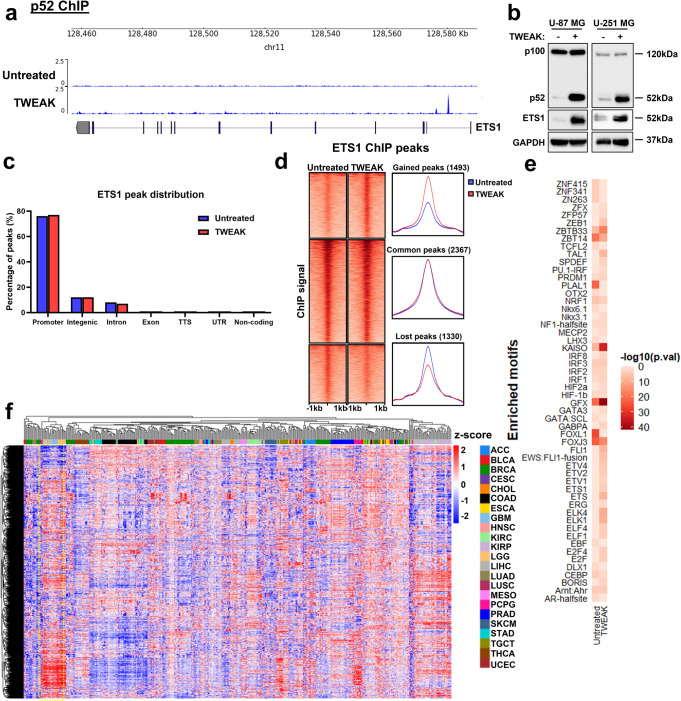
Fig. 1. p52 activation remodels ETS1 DNA binding dynamics in glioma cells.
a Genome browser view of ETS1 gene locus and p52 ChIP-seq tracks in untreated and TWEAK-treated U-87 MG cells. Following TWEAK activation, p52 binds to the ETS1 promoter. b ETS1 protein expression analysed by western blotting when NF-κB/p52 is activated via TWEAK exposure in glioma cell lines. c Genomic distribution of ETS1 DNA binding peaks in untreated and TWEAK-treated U-87 MG cells. d DNA binding dynamics of ETS1 in untreated and TWEAK-treated U-87 MG cells. Signal intensity across each region (±1 kb) is represented as a heatmap, and the average log2 fold change in signal of gained, lost or common ETS1 peaks following TWEAK treatment is displayed at the right. e Heatmap representation of the enriched ETS1 motifs in U-87 MG cells with and without TWEAK-induced NF-κB/p52 activation. f Heatmap depicting the chromatin accessibility signal at ETS1 regions following TWEAK activation in TCGA Pan-cancer ATAC-seq dataset. ATAC-seq signals of glioma patient samples (LGG—Brain Lower Grade Glioma, GBM—Glioblastoma multiforme) are marked in the yellow dotted box. TCGA study abbreviations can be found at https://gdc.cancer.gov/resources-tcga-users/tcga-code-tables/tcga-study-abbreviations.

