
Figure 1. Selpercatinib therapy duration.
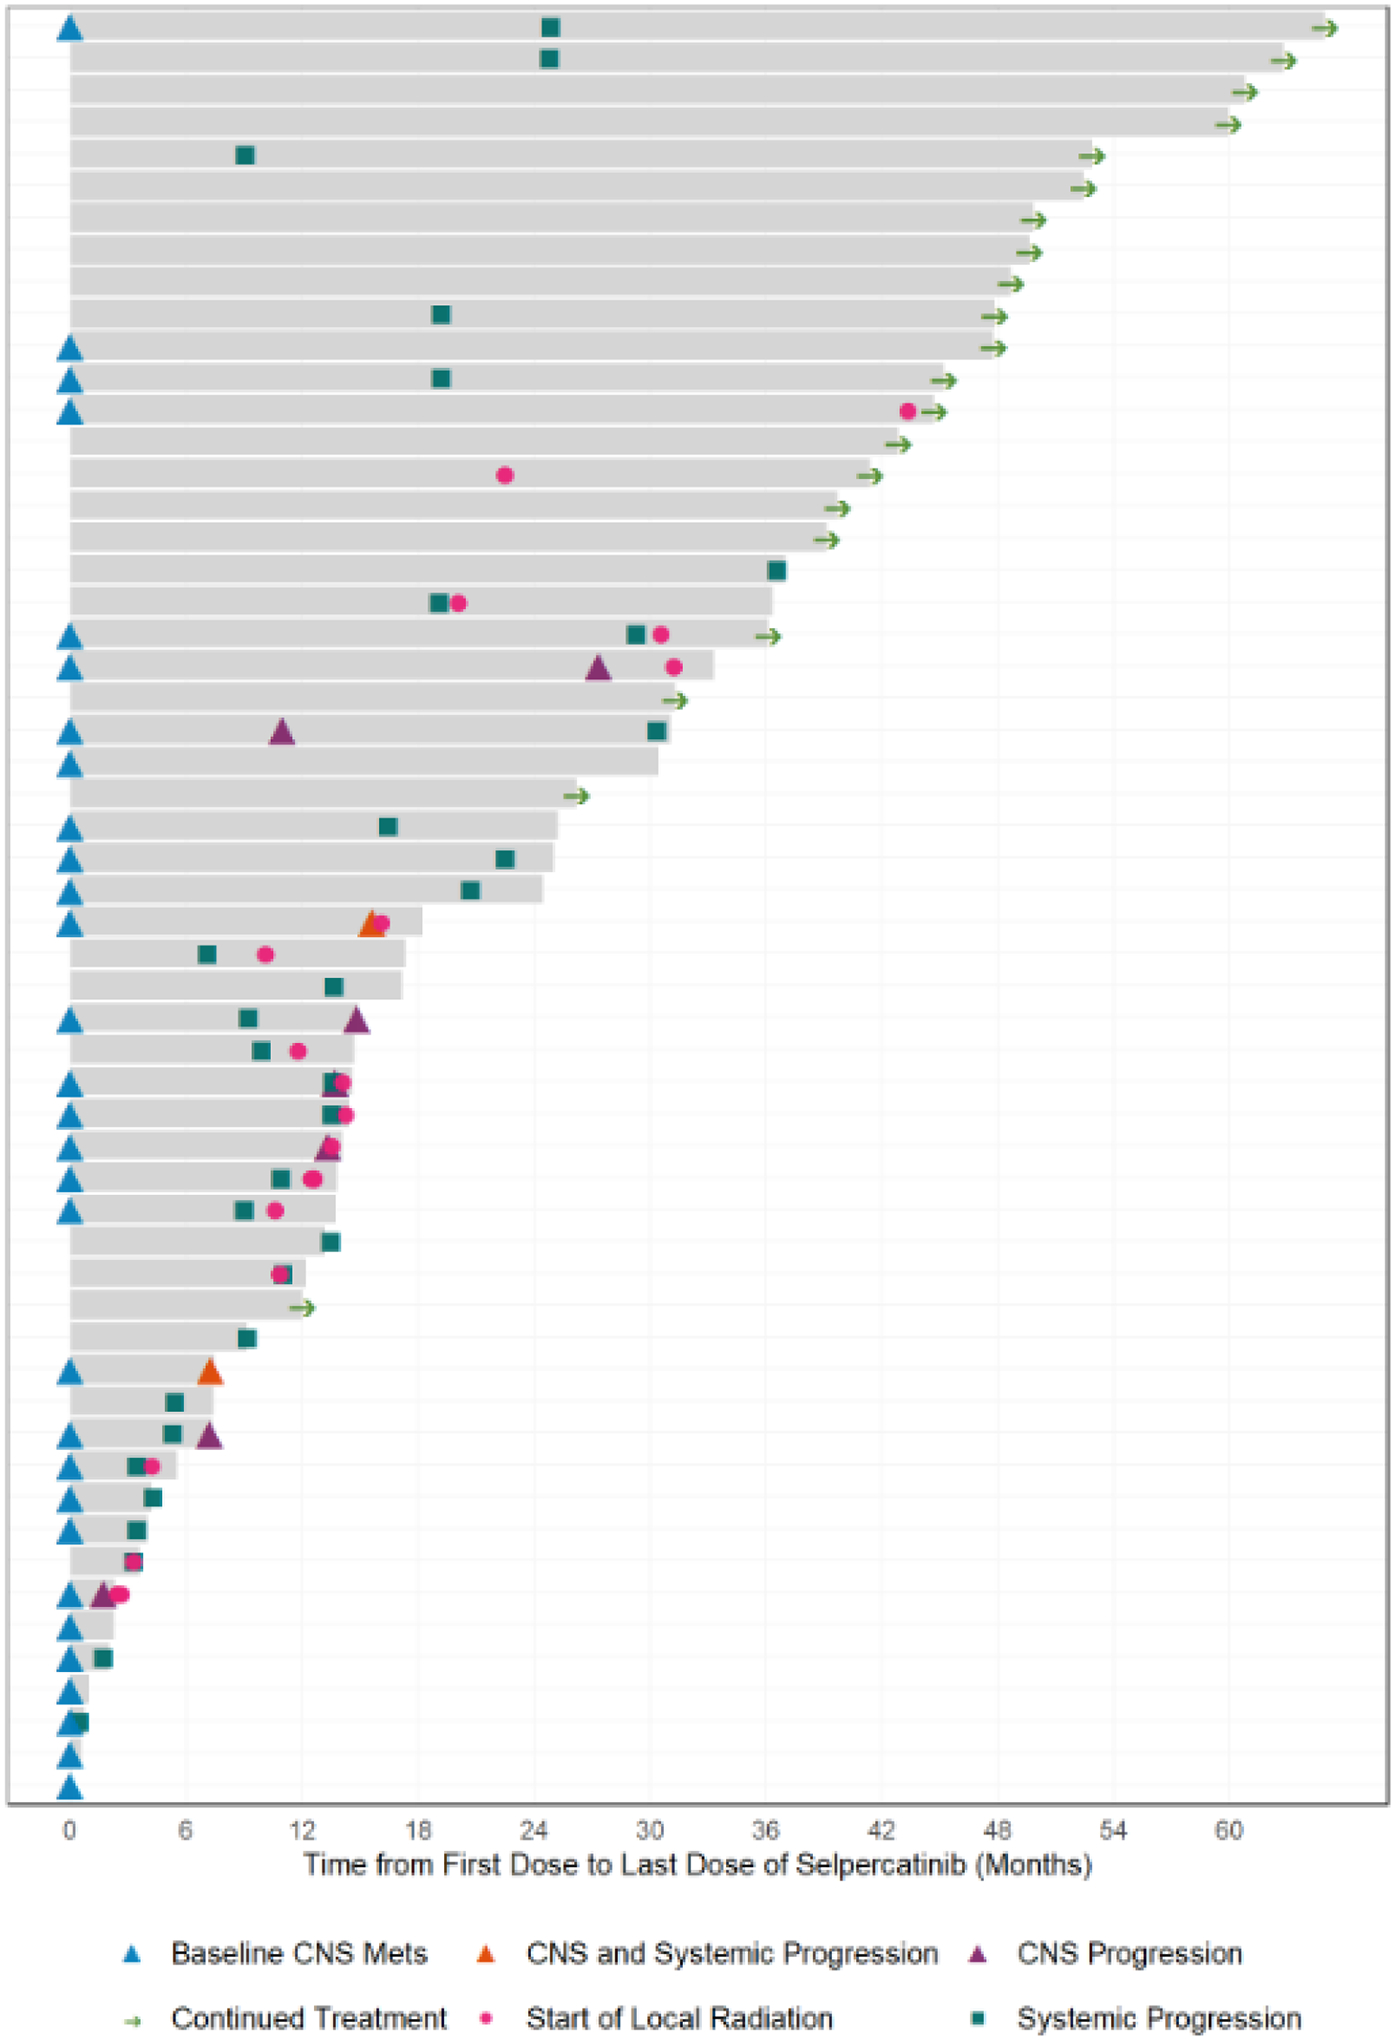
A swimmer’s plot showing time on therapy, systemic and/or CNS progression of disease, and radiation treatments administered while on selpercatinib is shown. Grey bars show time on treatment.
Official websites use .gov
A
.gov website belongs to an official
government organization in the United States.
Secure .gov websites use HTTPS
A lock (
) or https:// means you've safely
connected to the .gov website. Share sensitive
information only on official, secure websites.
A swimmer’s plot showing time on therapy, systemic and/or CNS progression of disease, and radiation treatments administered while on selpercatinib is shown. Grey bars show time on treatment.