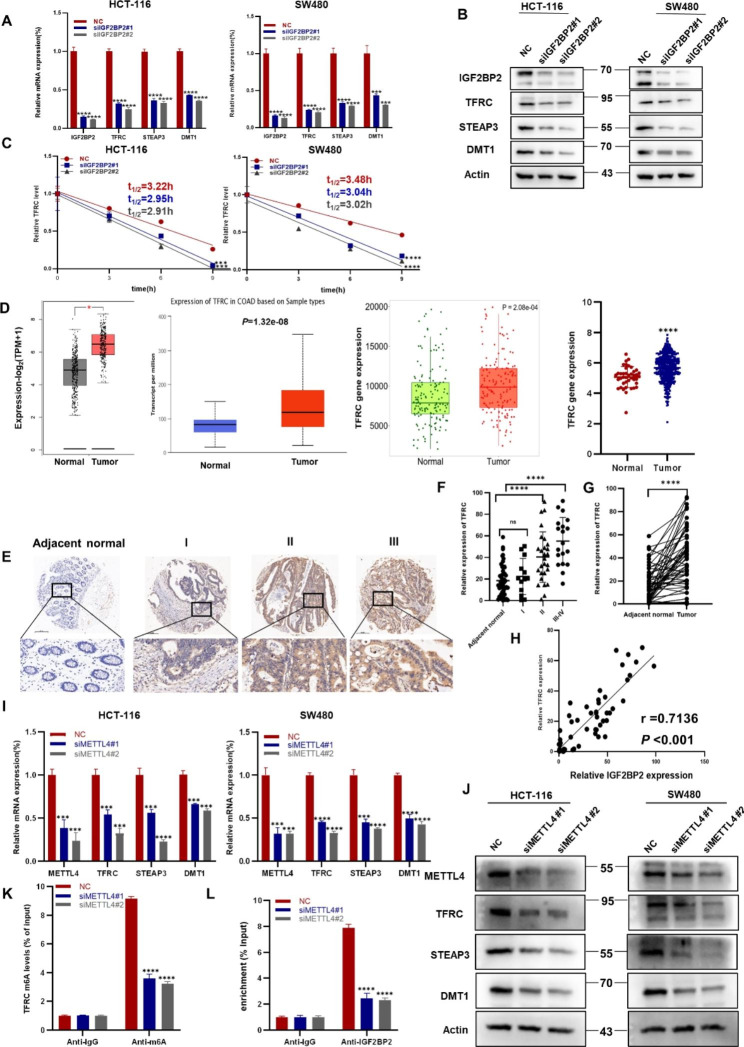
Fig. 4.
IGF2BP2 participates in colorectal cancer growth by regulating the expression of iron metabolism-related genes. (A, B) qRT-PCR (A) and western blotting (B) of the potential target genes and their products in HCT-116 and SW480 cells after IGF2BP2 knockdown. (C) The decay rate of mRNA and qPCR of TFRC at the indicated time points after treating HCT-116 and SW480 cells with actinomycin D (5 µg/ml) after IGF2BP2 inhibition. (D) Differences in TFRC expression between COAD tissue and normal tissue were analyzed using the GEPIA ((http://gepia.cancer-pku.cn/detail.php)), UALCAN (http://ualcan.path.uab.edu/), TNMplot (https://tnmplot.com/analysis/) and UCSC (https://xena.ucsc.edu/) databases. (E) The expression of TFRC in para-carcinoma tissues and CRC tumor tissues at various clinical stages as determined via IHC analysis. (F) Expression of TFRC in different stages of colorectal cancer and adjacent normal tissues (n = 50). (G) TFRC expression in colorectal cancer tissues and adjacent normal tissues (n = 50). (H) Correlation between IGF2BP2 and TFRC expression in COAD in tissue microarrays. (I, J) Relative mRNA expression of METTL4, an iron metabolism gene, was determined using qRT-PCR (I) and western blotting (J). (K) m6A-RIP assay was performed to detect m6A levels in TFRC mRNA in HCT-116 cells after METTL4 silencing. (L) Binding of IGF2BP2 to TFRC was verified using the RIP assay. Each value represents the mean ± SD for triplicate samples (Student’s t-test). *P < 0.05, ***P < 0.001 and **** P < 0.0001

