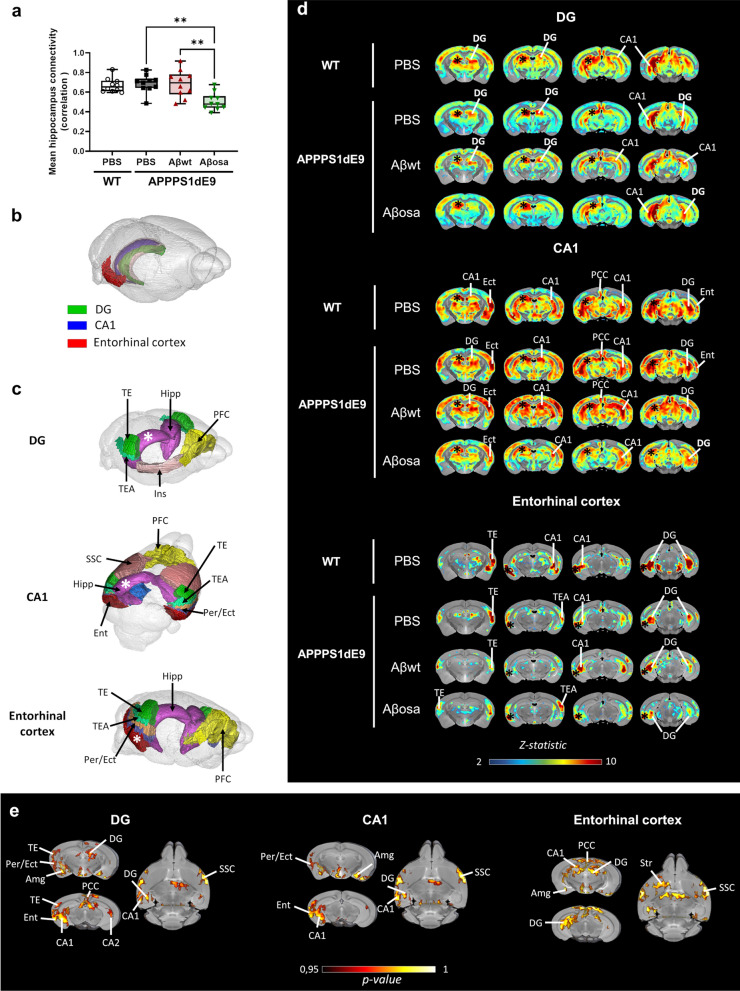
Fig. 4.
Aβosa inoculated animals displayed abnormal brain connectivity within hippocampal-memory circuits. a. Mean hippocampus connectivity changes measured by resting-state functional MRI. Aβosa-inoculated group displayed a decreased hippocampus connectivity compared to PBS and Aβwt-inoculated mice at 4mpi (Kruskal–Wallis with Dunn’s multiple comparisons. group effect p = 0.002; p = 0.006 and p = 0.01 for Aβosa-inoculated group versus PBS or Aβwt-inoculated mice). b. 3D representation of the three brain regions -DG, CA1 and the entorhinal cortex- used for the seed-based analyses (SBA). c. SBA-derived resting state networks found in PBS-inoculated APPswe/PS1dE9 are shown for each seed (the white asterisk represents the location of the seeds where the signal was extracted). d. Correlation maps of each seed. The color scale bar represents the strength of the functional correlation normalized with a fisher z-transformation. Black asterisks represent the location of the seeds. Differences are found between groups in inter-hemispheric homotopic FC. e. Voxelwise nonparametric permutation tests of FC correlation maps. Aβosa-inoculated mice have a lower FC in the hippocampus compared to PBS-inoculated mice (p < 0.001). The color scale bar represents the statistical significant p-value. DG = dentate gyrus, Hipp = hippocampus, TE = temporal area, TEA = temporal associative area, Per/Ect = perirhinal + ectorhinal cortex, Ins = Insular, Amg = amygdalar area, Ent = entorhinal cortex, PCC = posterior cingulate cortex, SSC = primary somatosensory area, Str = striatum. nWT-PBS = 10, nAPP/PS1-PBS = 10, nAβwt = 10, nAβosa = 10 mice

