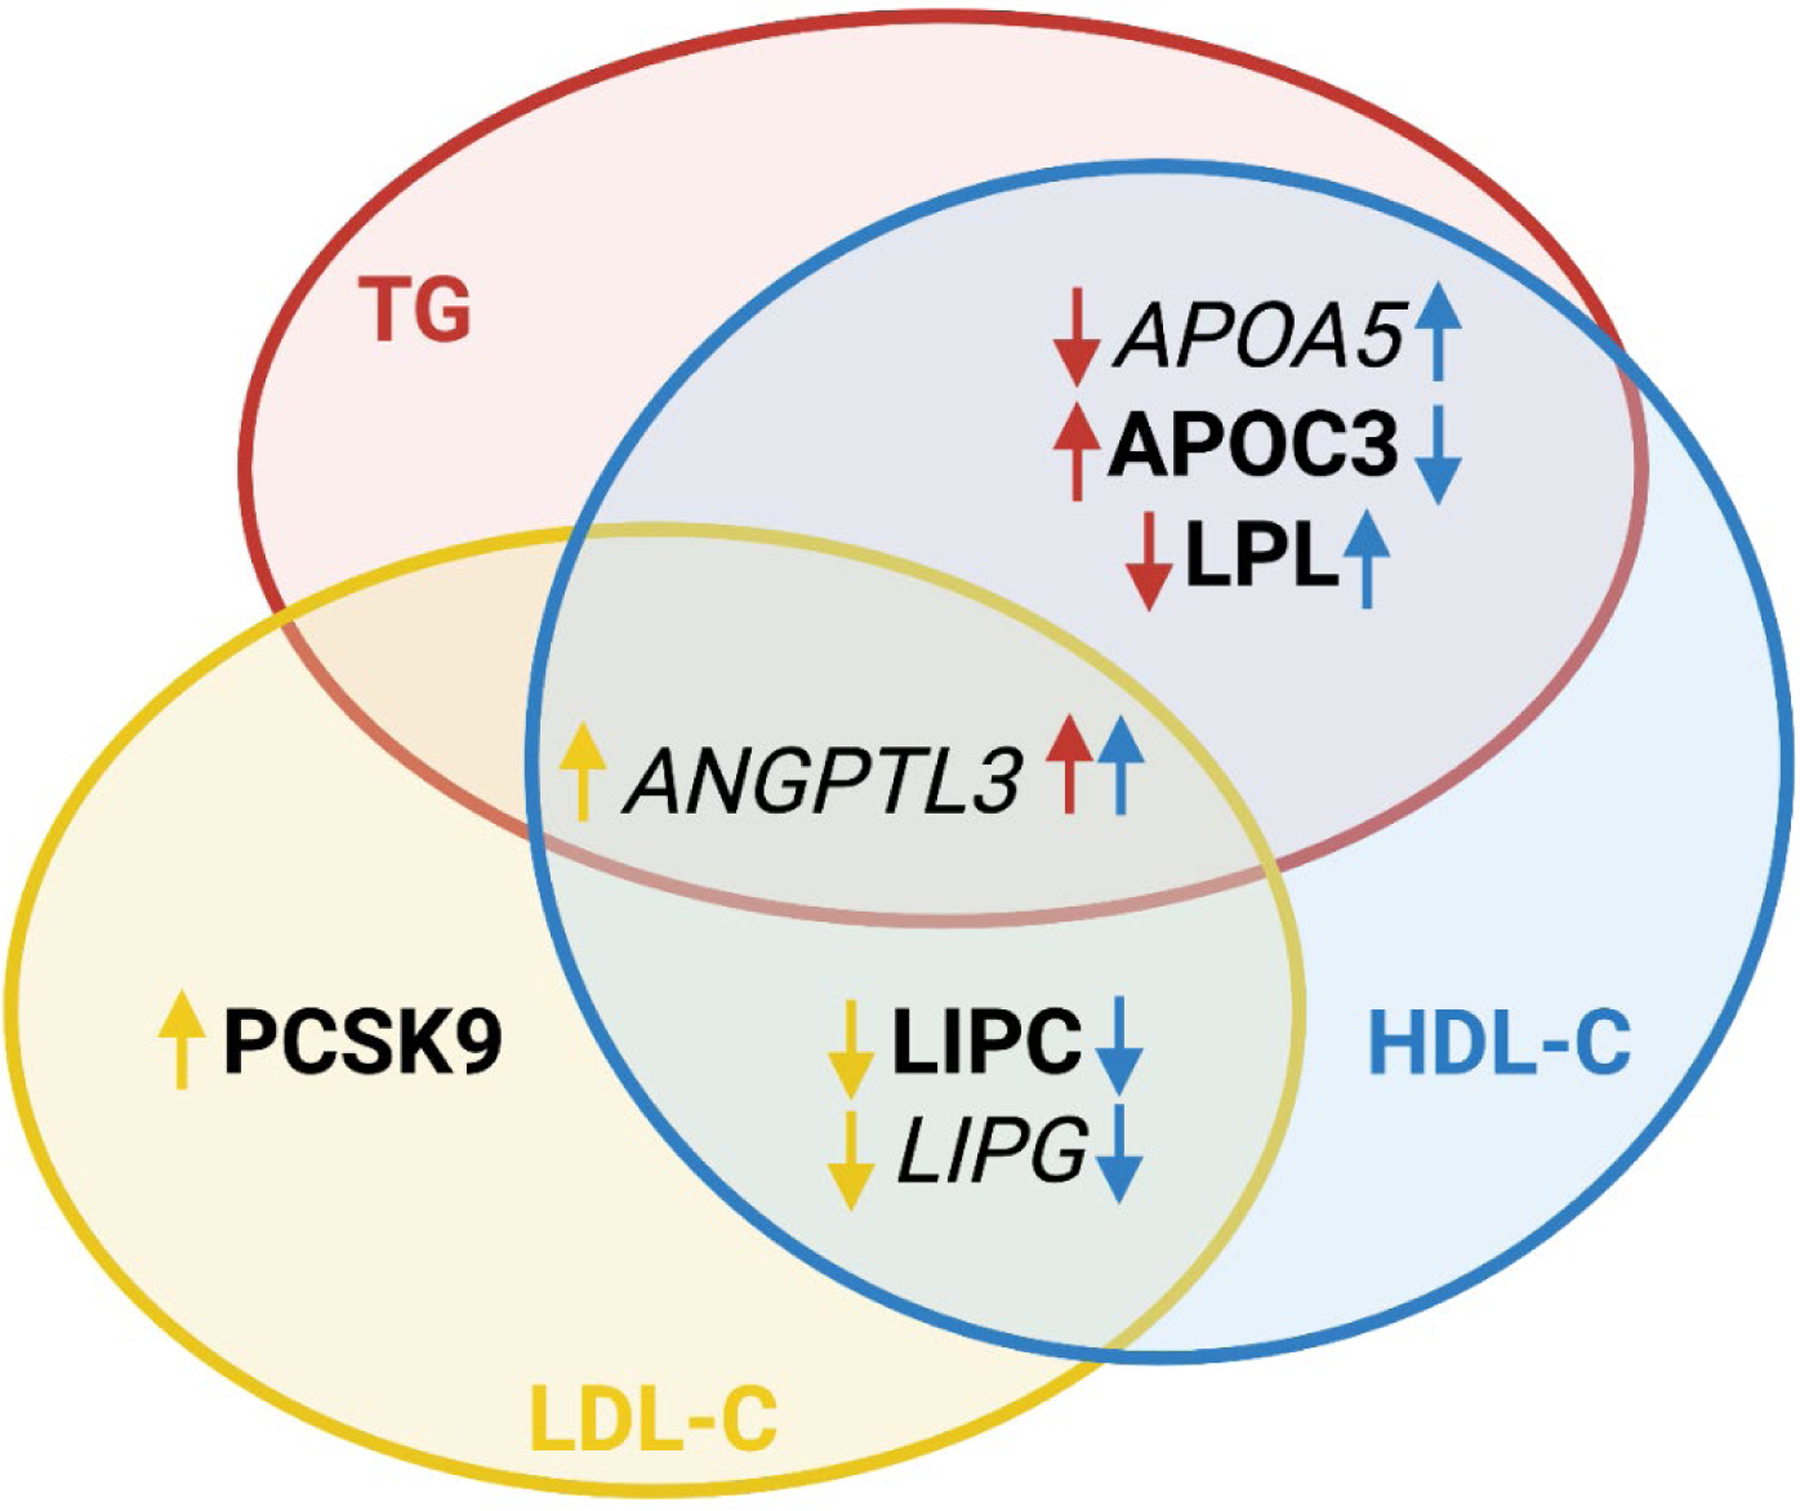
Figure. Observed or predicted effects on plasma lipids by gain-of-function (GoF) variants in selected lipid genes.

The diagram depicts the observed (bold) and predicted (italic) effects of GoF variants in selected genes on triglycerides (TG), low-density lipoprotein cholesterol (LDL-C), and high-density lipoprotein cholesterol (HDL-C). Color of the arrows refers to the lipid parameter affected by GoF variants in indicated genes: red - TG, blue - HDL-C, and yellow - LDL-C. Direction of the arrows indicates the direction of effect: ↑ increase or ↓ decrease of indicated lipid parameters. Gene symbols: APOA5, apolipoprotein A5; APOC3, apolipoprotein C3; LPL, lipoprotein lipase; ANGPTL3, angiopoietin like 3; PCSK9, proprotein convertase subtilisin/kexin type 9; LIPC, lipase C, hepatic type; LIPG, lipase G, endothelial type.
