
FIGURE 2.
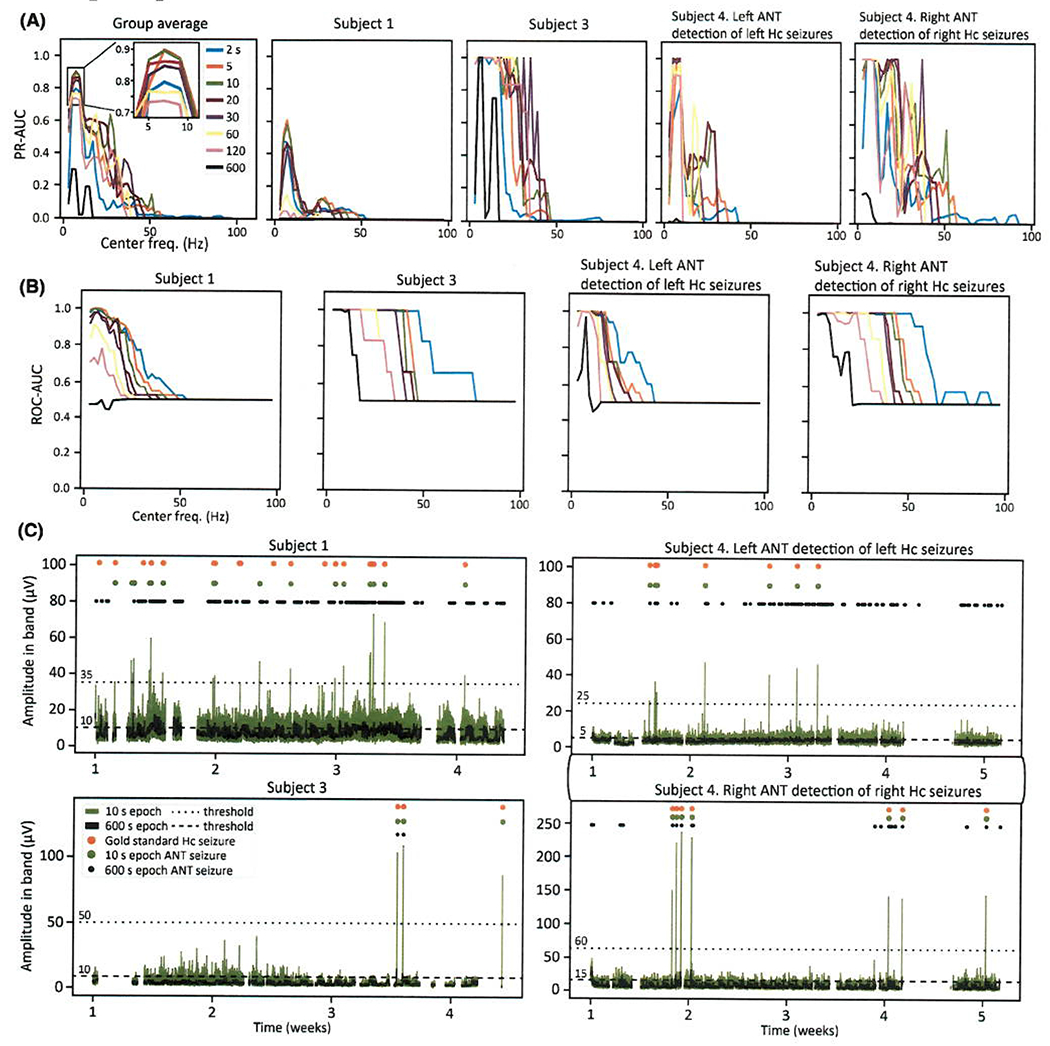
(A) Anterior nucleus of the thalamus (ANT) power-in-band (PIB) trend-based seizure detection area under the precision-recall curve (PR-AUC) across all tested center frequencies and epoch durations. The group average is the average PR-AUC value across Subjects 1, 3, and 4 shown in the right four panels. A random classifier has PR-AUC < .001 for all subjects (random classifier PR-AUC = P/[P + N], where P = the total number of “positives” [gold standard seizures] and N = the total number of “negatives” [the number of interictal segments]12). Five-hertz bandwidth was used for all plots in Figure 2. (B) Receiver operating characteristic (ROC)-AUC plots corresponding to A. A random classifier has ROC-AUC = .50. (C) RC + S-derived ANT PIB trend data using optimized seizure detection parameters (7-Hz center frequency, 5-Hz bandwidth, 10-s epoch) and optimized parameters with 10-min epoch duration. Visually confirmed hippocampus (Hc) seizure detections and ANT PIB trend-based seizure detections are marked. Detection thresholds are marked by dashed lines