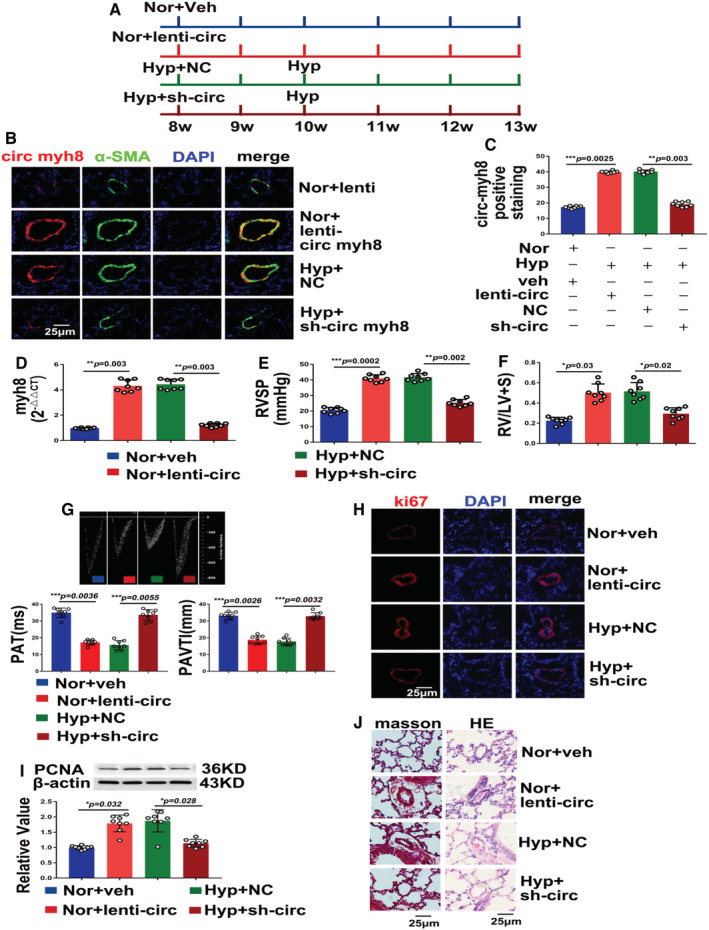
Figure 2. Circ‐myh8 promotes the development of hypoxia‐induced pulmonary hypertension.

A, Schematic diagram of circ‐myh8 overexpression and knockdown mice models under normoxia or hypoxia. B, Fluorescent in situ hybridization (FISH) for circ‐myh8 (red) and immunofluorescence (IF) for α‐smooth muscle actin (αSMA, green) in the pulmonary artery (PA). Mice were overexpressed with circ‐myh8 lentivirus plasmid (lenti‐circ myh8), empty vector (lenti), or knockdown with sh‐circ myh8 or negative control (NC) under normoxia (21% FiO2) or hypoxia (10% FiO2) for indicated times. The profiles of colocalization were also provided. Nuclei are counterstained with DAPI (blue). Scale bar, 25 μm. C, Statistical analysis of circ‐myh8 expression in (B). D, Reverse transcription‐quantitative polymerase chain reaction (RT‐qPCR) assay for circ‐myh8 expression in PAs from mice at the indicated treatment. E, Right ventricular systolic pressure (RVSP) was measured by right heart catheter. F, The Felton index was calculated as the ratio of right ventricular and left ventricular plus spatial weight. G, Representative image of hemodynamic (top panel), summarized data of PAT (left bottom) and PAVTI (right bottom) measured by ultrasound. H, immunofluorescence for ki67α (red) in pulmonary artery (PAs) section. The profiles of colocalization were also provided. Nuclei are counterstained with DAPI (blue). Scale bar, 25 μm. I, Representative images and summarized data of PCNA expression analysis by western blot. J, Representative images of Masson trichrome and hematoxylin and eosin staining in lung from the indicated treatment mice. Scale bar, 25 μm. Data represent means±SEM from indicated independent experiments. Student's t test (for 2 means) or 1‐way ANOVA followed by Dunnett's test (for >2 means). Hyp indicates hypoxia; lenti‐circ, lenti‐circ‐myh8; NC, negative control; Nor, normoxia; PAT, pulmonary artery acceleration time; PAVTI, pulmonary artery velocity time integral; PCNA, proliferating cell nuclear antigen; and veh, vehicle. *P<0.05, **P<0.01, ***P<0.001.
