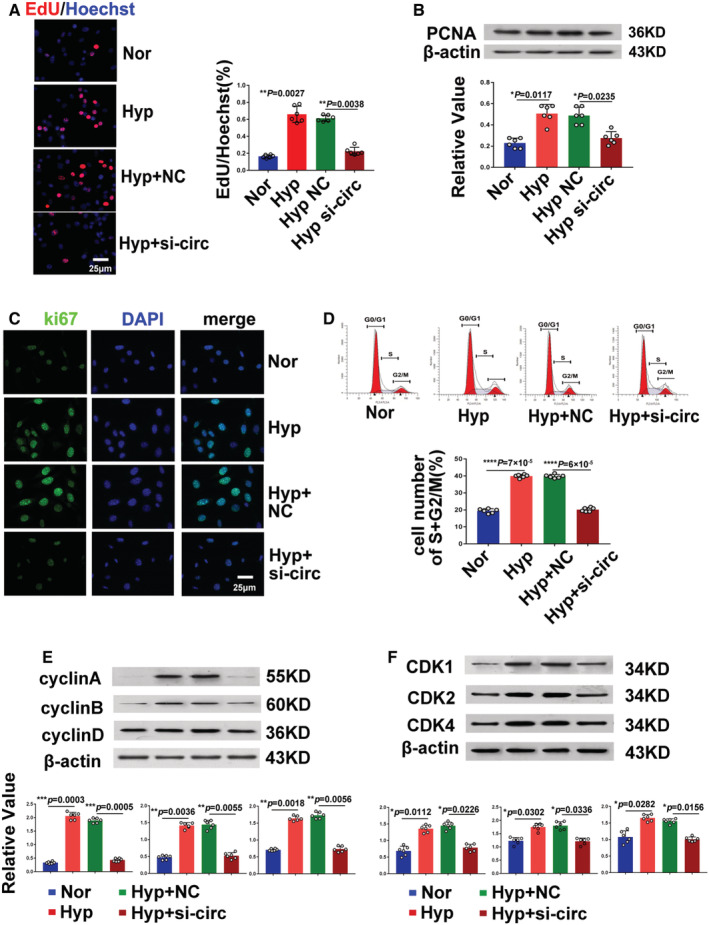
Figure 3. Silencing of circ‐myh8 reverses hypoxia‐induced proliferation and cell‐cycle progression of pulmonary artery smooth muscle cells (PASMCs) in vitro.

A, Representative images and summarized data EdU staining in PASMCs. PASMCs were transfected with circ‐myh8 siRNA or NC, and then exposed to hypoxia (0.3% FiO2) for 24 hours, with the nuclei stained by Hoechst (blue). Scale bar, 25 μm. B, Representative images and summarized data of PCNA expression analysis by western blot. C, Immunofluorescence for ki67α (red) in PASMCs. The profiles of colocalization with DAPI (blue) were also provided. Scale bar, 25 μm. D, Flow cytometry of the cell cycle of PASMCs. E, Representative images and summarized data of cyclin A, cyclin B, and cyclin D expression by western blot. F, Representative images and summarized data of cell‐cycle–dependent kinases (CDK1, CDK2, and CDK4) by western blot. Data represent means±SEM from indicated independent experiments. Student's t test (for 2 means) or 1‐way ANOVA followed by Dunnett's test (for >2 means). CDK indicates cyclin‐dependent kinase; Hyp, hypoxia; NC, negative control; Nor, normoxia; and PCNA, proliferating cell nuclear antigen. *P<0.05, **P<0.01, ***P<0.001, ****P<0.0001.
