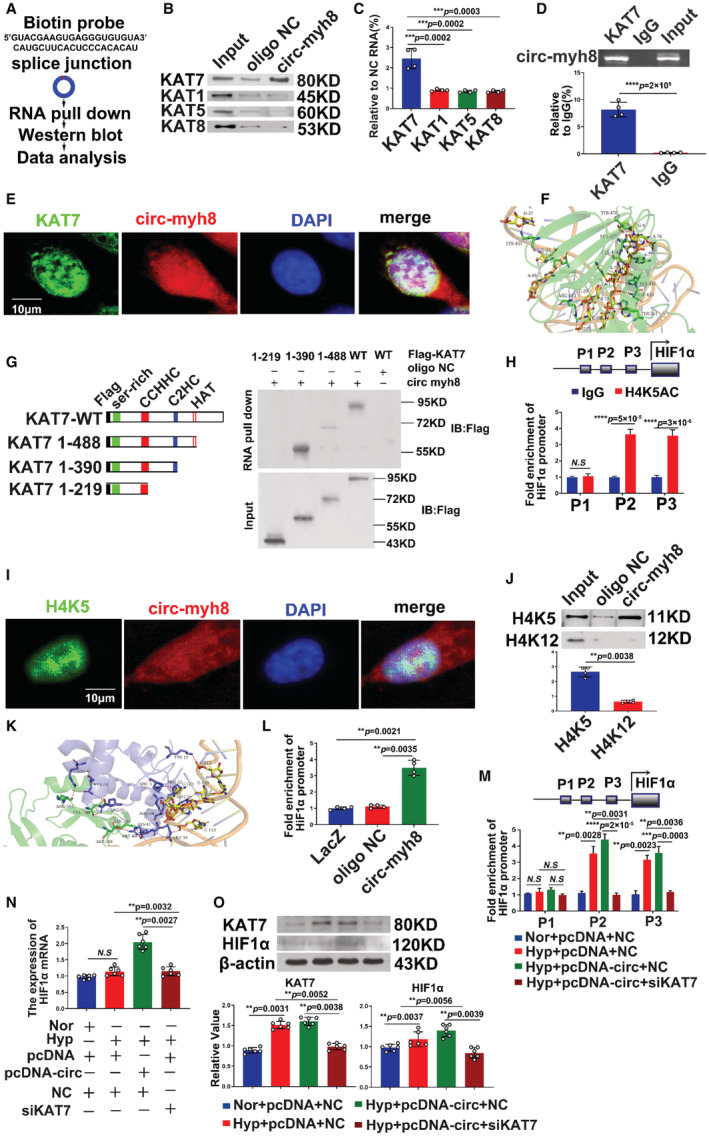
Figure 6. Circ‐myh8 acts as a modular scaffold to recruit KAT7 to the promoters of the HIF1α gene.

A, The experimental design for RNA pull‐down assay. RNA pull‐down was performed using a biotinylated circ‐myh8 probe, followed by western blot. B and C, Representative image (B) and summarized data (C) of RNA pull‐down assay followed by western blot for candidate proteins KAT1, KAT5, KAT7, and KAT8 in pulmonary artery smooth muscle cells (PASMCs). D, RIP assay for the binding of three candidate proteins with circ‐myh8. RIP was performed using KAT1, KAT5, KAT7 and KAT8 antibodies, followed by RT‐qPCR assay for circ‐myh8 expression in PASMCs. E, Fluorescent in situ hybridization (FISH) for circ‐myh8 (red) and immunofluorescence (IF) for KAT7 (green) in PASMCs, with the nuclei staining by DAPI (blue). The profiles of colocalization were also provided. Scale bar, 5 μm. F, The molecular docking of the interaction between circ‐myh8 fragment (131 base sequence upstream and downstream of that end‐to‐end junction, marked yellow cartoon) and KAT7 (shown as green). G, RNA pull‐down assay after transfection of wild type and truncated KAT7 expression plasmids using biotin‐labeled oligo or circ‐myh8 probes in PASMCs (right panel). The design of the truncated KAT7 expression plasmids (left panel). H, ChIP assay for H4K5ac level in HIF1α promoter regions. Final DNA extractions were PCR amplified using primers that cover P1 (−5837 to −5675 bp), P2 (−803 to −554 bp) and P3 (−403 to −172 bp) sites in HIF1α promoter. I, FISH for circ‐myh8 (red), and immunofluorescence for H4K5ac (green) in PASMCs, with the nuclei staining by DAPI (blue). The profiles of colocalization were also provided. Scale bar, 5 μm. J, RNA pull‐down assay followed by western blot for candidate proteins H4K5 and H4K12 in PASMCs. K, Z‐DOCK of prediction of the trimer complex structure of circ‐myh8 fragment (marked yellow cartoon), H4K5ac (marked blue cartoon), and KAT7 (marked green cartoon). A red dotted line marked the significant binding interaction. L, Chromatin isolation by RNA purification analysis for the binding of circ‐myh8 to HIF1α promoter in PASMCs. LacZ and oligo NC served as negative controls. M, ChIP assay for H4K5ac levels in HIF1α promoter promoters after KAT7 knockdown. PASMCs were transfected with circ‐myh8 or control plasmids, with KAT7 siRNA and the corresponding control. Cells were harvested for ChIP assay 24 hours later. N, RT‐qPCR for HIF1α mRNA expression in PASMCs treated as in (M). O, Western blot assay for KAT7 and HIF1α protein levels in PASMCs treated as in (M). Cells were exposured to hypoxia for 24 hours, and then harvested for western blot analysis. Data represent means±SEM from indicated independent experiments. Student's t test (for two means) or one‐way ANOVA followed by Dunnett's test (for >2 means). H4K12 indicates histone H4 lysine 12; H4K5, histone H4 lysine 5; HIF1α, hypoxia inducible factor alpha; Hyp, hypoxia; KAT, lysine acetyltransferase; LacZ, beta‐galactosidase; NC, negative control; Nor, normoxia; RT‐qPCR, reverse transcription‐quantitative polymerase chain reaction; and veh, vehicle. *P<0.05; **P<0.01, ***P<0.001.
