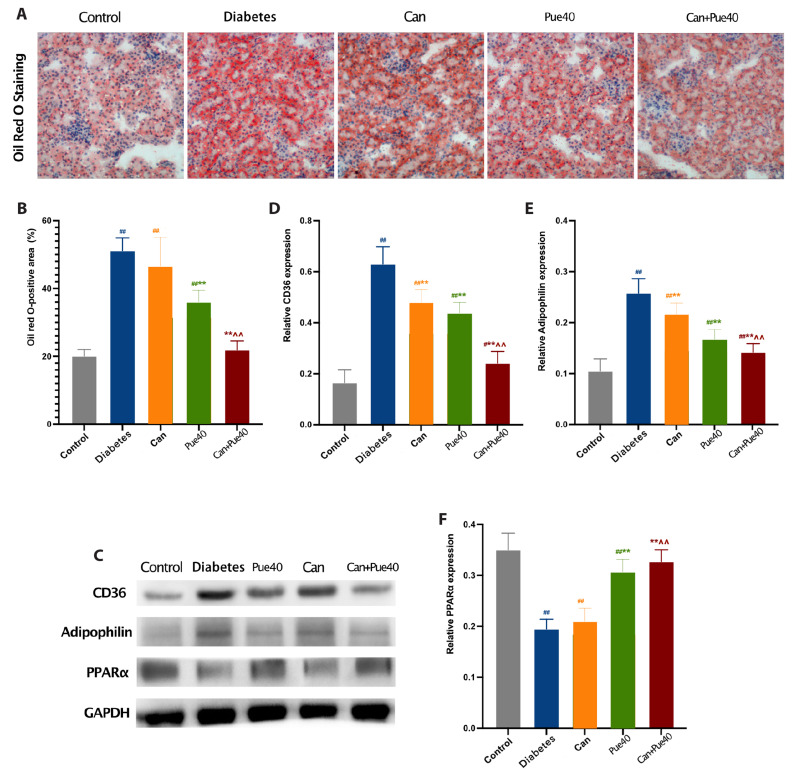
Fig. 3. Effect of canagliflozin and puerarin on lipid homeostasis of kidneys.
(A) Representative image of oil red O staining (100×) of kidney sections. (B) Oil red O-positive area in the kidney. (C) Western blot of CD36, adipophilin, and PPARα in the kidney. (D) Relative expression of CD36. (E) Relative expression of adipophilin. (F) Relative expression of PPARα. Data are shown as mean ± SD (n = 6). #p < 0.05, ##p < 0.01 vs. control group; **p < 0.01 vs. diabetes group; ^^p < 0.01 vs. canagliflozin group.

