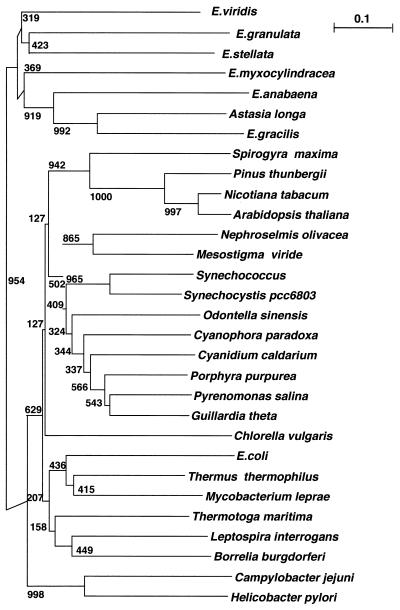
Figure 4.
Phylogenetic NJ tree inferred from a rpoA sequence comparison. Branch lengths are proportional to the expected mean number of substitutions per site along the branch, as quantified by the scale bar. The tree was generated using CLUSTAL X (GCG Sequence Analysis Package v.8.0). Boostrap numbers for the 1000 boostrap replications conducted are indicated.

