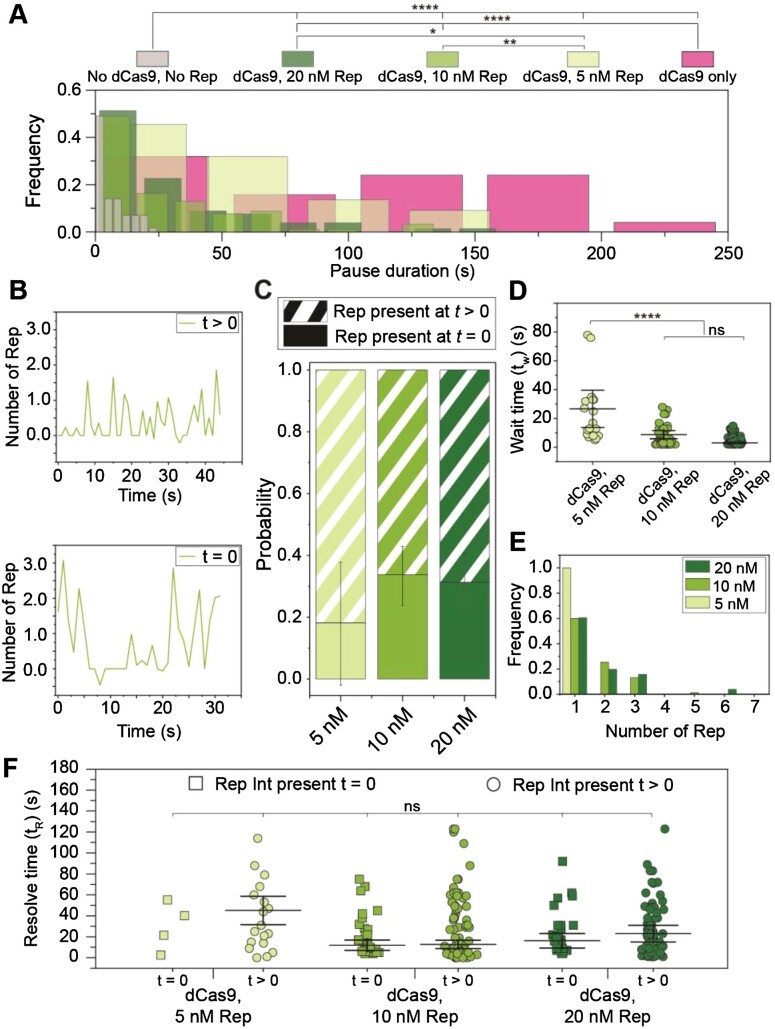
Figure 5.
Observations of Rep at stalled replisomes. (A) Duration of a pause is decreased at increasing concentrations of Rep. In the presence of 0.25 nM dCas9 only, mean pause duration is determined from fitting a Gaussian distribution function (140 ± 60 s (S.E.M.), n = 25 pauses). In the presence and absence of dCas9-cgRNA1 and Rep-AF647, mean pause duration is determined by fitting single-exponential decay functions to the data (No dCas9-cgRNA1, No Rep-AF647, 5 ± 2 s, n = 57 pauses; dCas9-cgRNA1 and 5 nM Rep-AF647, 80 ± 40 s, n = 22 pauses; dCas9-cgRNA1 and 10 nM Rep-AF647, 20 ± 7 s, n = 92 pauses; dCas9-cgRNA1 and 20 nM Rep-AF647, 20 ± 9 s, n = 80 pauses). Pause durations of titrated Rep conditions represent pauses where a Rep-AF647 intensity was observed above a threshold. (B) Example traces of the number of Rep-AF647 present during a pause as a function of time. Two distinct types are observed; Rep-AF647 intensity above the threshold is reached at t > 0 (top), and Rep-AF647 intensity above the threshold is reached at t = 0. (C) The probability of observing the two Rep-AF647 activities during a pause for each concentration of Rep. Error bars indicate the margin of error for each concentration. (D) Distribution of the wait time (tw) for a Rep-AF647 molecule to associate to the replication fork in t> 0 events. Mean wait time for each concentration of Rep-AF647 was determined from fitting a single-exponential decay function to the data: 5 nM Rep-AF647, 30 ± 40 s (n= 18 pauses); 10 nM Rep-AF647, 9 ± 3 s (n= 76 pauses); 20 nM Rep-AF647, 3 ± 1 s (n= 78 pauses). (E) Histogram showing distributions of the number of Rep-AF647 molecules that associated first during a pause at tw reveal predominantly monomeric stoichiometry at all concentrations used. (F) Pause resolve time (tR) for t= 0 (squares) and t> 0 (circles) events. The mean pause resolve times were determined by fitting a single-exponential decay function to the data of each concentration: 5 nM Rep-AF647, (t= 0) no fit converged (n = 4 pauses), and (t> 0) 50 ± 60 s (S.E.M.); 10 nM Rep-AF647, (t= 0) 12 ± 2 s (n = 31 pauses), and (t> 0) 13 ± 4 s; 20 nM Rep-AF647, (t= 0) 17 ± 7 s (n = 25 pauses), and (t> 0) 20 ± 8 s. Comparison of distributions was conducted by Kruskal-Wallis test for multiple comparisons with Dunn's procedure, where *, ** and **** denote statistical significance with p ≤0.05, 0.01 and 0.0001, respectively. Absence of markers or ns denotes no significance difference (p > 0.05).

