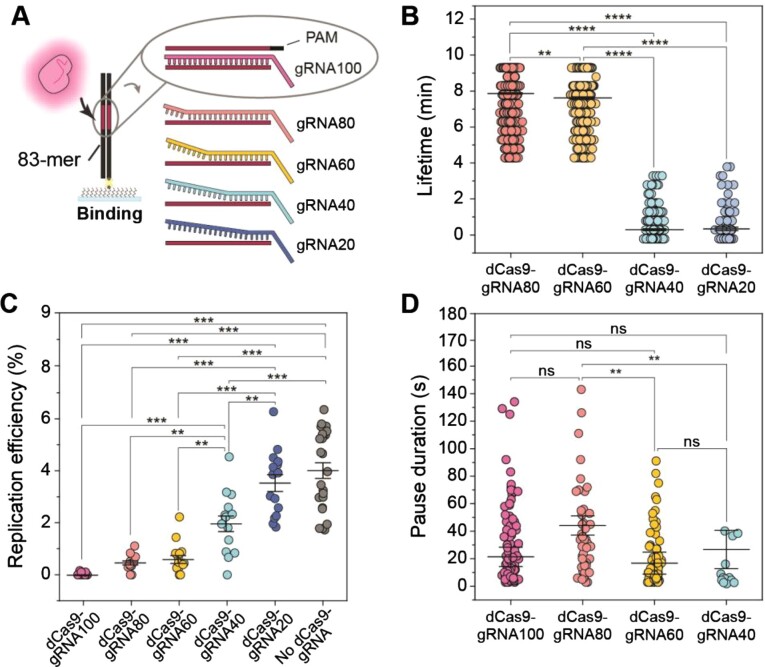
Figure 6.
Stalled replication rescue at less stable roadblocks. (A) Schematic representation of dCas9-gRNA mismatch complexes binding to 83-mer dsDNA oligonucleotides in single-molecule lifetime assays. (B) Lifetime distributions of dCas9-MMgRNA complexes binding to 83-mer dsDNA. Mean lifetime for each complex: dCas9-gRNA80, 8.6 ± 0.1 min (S.E.M.; n= 1414 events); dCas9-gRNA60, 8.3 ± 0.1 min (n= 619 events); dCas9-gRNA40, 1.0 ± 0.1 min (n= 249 events); dCas9-gRNA20, 1.0 ± 0.1 min (n= 103 events). Comparison of distributions was conducted by Kruskal-Wallis test for multiple comparisons with Dunn's procedure, where ** and **** denote statistical significance with p ≤ 0.01 and 0.0001, respectively. Absence of markers denotes no significance difference (p > 0.05). (C) The efficiency of replication distributions of DNA templates following pre-incubation with dCas9-gRNA complexes. Mean efficiencies for each complex: dCas9-gRNA100, 0.02 ± 0.01%; dCas9-gRNA80, 0.5 ± 0.1%; dCas9-gRNA60, 0.6 ± 0.1%; dCas9-gRNA40, 2.0 ± 0.3%; dCas9-gRNA20, 3.5 ± 0.3%; No dCas9 complexes, 4.0 ± 0.3%. Comparison of the mean replication efficiency was done using one-way ANOVA with Tukey's comparison post-hoc test, where ** and *** denote statistical significance with p ≤ 0.01 and 0.001, respectively. Absence of markers indicates no significance difference (p > 0.05). (D) Pause duration distributions in the presence of dCas9-MMgRNA complexes and Rep-AF647. Mean pause durations were determined from fitting a single-exponential decay function to the data of each complex: dCas9-gRNA80, (40 ± 20 s (S.E.M.), n = 51 pauses, replication efficiency of 3 ± 1%); dCas9-gRNA60, (20 ± 6 s, n = 72, 3 ± 1%); dCas9-gRNA40, (30 ± 14 s, n = 16, 4 ± 1%). dCas9-gRNA100 data are duplicated from Figure 5A (dCas9-cgRNA1 and 10 nM Rep-AF647). Pause durations represent pauses where Rep-AF647 intensity was observed above the threshold. Comparison of distributions was done by Kruskal-Wallis test for multiple comparisons with Dunn's procedure, where ** denotes statistical significance with p ≤ 0.01 and ns denotes no significance difference (p > 0.05).

