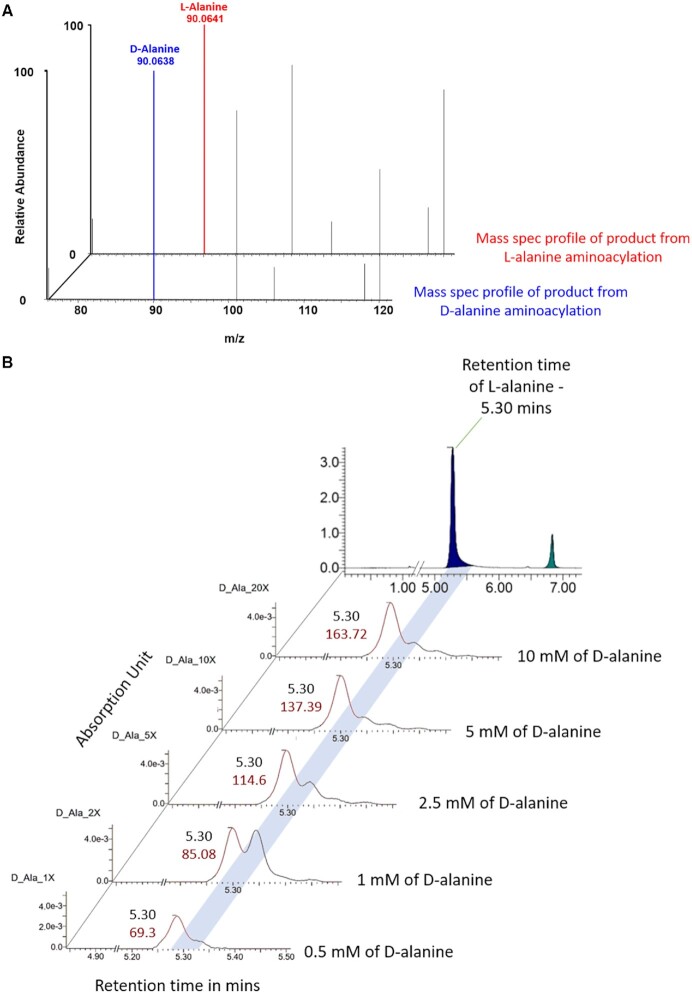
Figure 6.
AlaRS charges L-Ala contaminant in D-alanylation reaction. (A) ESI-MS profile of resultant product after aminoacylated by EcAlaRS using D- and L-alanine. (B) Chromatograms showing that area of the peak corresponding to L-alanine in D-alanine sample is increasing upon titration of increasing concentration of D-alanine in the reaction.

