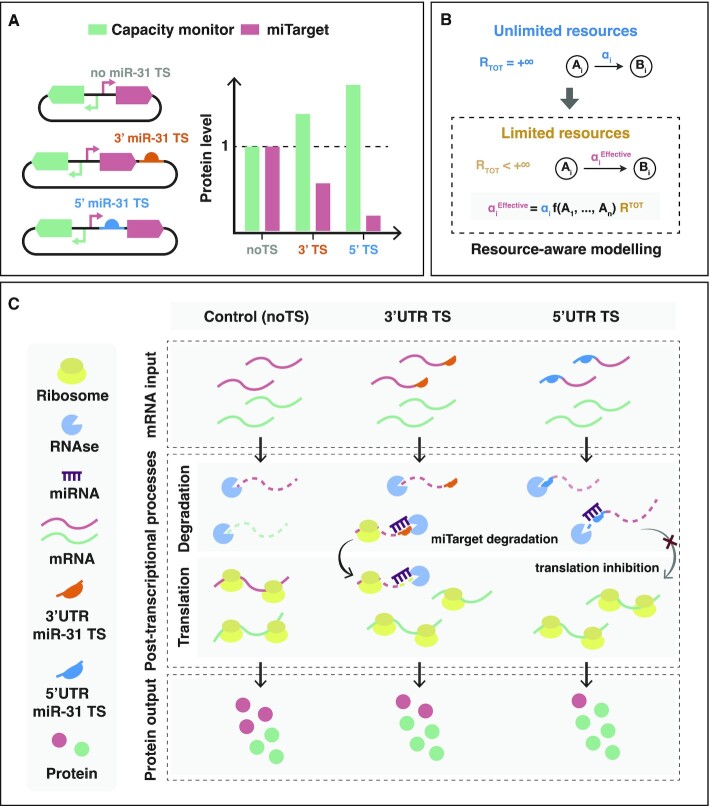
Figure 1.
Graphical abstract of the study. (A) Graphical representation of the effect of the downregulation of a transgene (mKate-miTarget, red) by endogenous miRNAs (e.g. miR-31), on a co-expressed gene (capacity monitor, green) (1). The stronger the downregulation of the miTarget, the more the upregulation of the capacity monitor, in a miRNA target sites (TS) number- and location-fashion 5’UTR (blue) or 3’UTR (orange). (B) Modelling of gene networks in a resource-limited context. MIRELLA replaces all reaction rates ( ) that involve shared cellular resources with their corresponding effective reaction rates (namely
  ) that capture the availability of that resources according to the overall demand from competing genes (modelled via the general function
  ). (C) Effect of miRNA activity on protein expression in a finite-resource context. Control (noTS): protein expression in the absence of miRNA regulation. TS in the 5’ or 3’UTR: the slicer activity of miRNA-RISC complex triggers mRNA degradation of the miTarget (red) causing a queueing effect on the degradation of other mRNAs that results in capacity monitor (green) protein accumulation. TS in the 5’UTR: in addition to slicer activity, miRNA binding inhibits translation initiation, freeing up translational resources to the benefit of other transcripts (e.g. the capacity monitor). The resulting effect is stronger downregulation of miTarget and higher capacity monitor levels when TS are placed in the 5’UTR of the miTarget.

